本页面提供的是上一版软件的文档。当前版本中已删除对应的英文页面。
矢量与栅格地图显示
在地图上显示矢量或栅格数据
矢量数据使用点、线和多边形来表示事件、位置和对象。例如,您可以用点表示城市,用线表示河流,用多边形表示国家。栅格数据以矩阵形式存储网格化数据,例如卫星影像和地形高程网格。使用这些函数在地图上显示矢量和栅格数据。
函数
属性
| Point Properties | Geographic point appearance and behavior (自 R2022a 起) |
| Line Properties | Geographic chart line appearance and behavior (自 R2022a 起) |
| Polygon Properties | Geographic polygon appearance and behavior (自 R2022a 起) |
| IconChart Properties | Icon chart appearance and behavior (自 R2024b 起) |
主题
矢量地图显示
- Display Vector Data as Points and Lines
Display vector data using discrete points, and connect the points with a great circle track and a rhumb line track. - Display Vector Data as Lines and Patches
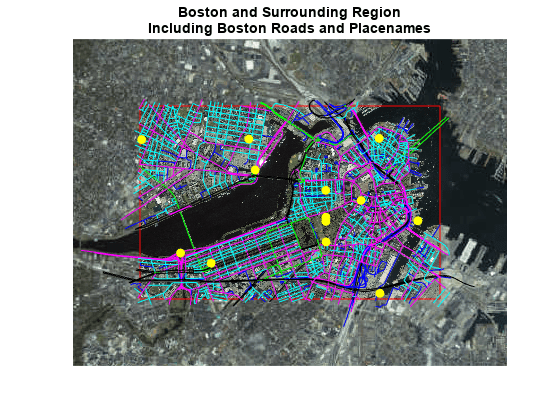
Display vector data using connected line segments and closed polygons. - Create Maps Using Icons
Use icons on maps to represent and display data, animate movement along paths, and annotate basemaps. (自 R2024b 起) - Control Color and Transparency of Icon Chart
Change the color or hide the background of an icon by using the color and transparency properties of the icon chart object. (自 R2024b 起)
栅格地图显示
- Fit Gridded Data to Graticule
A graticule is a grid of meridians and parallels that guides the placement of features on a map. A finer graticule provides greater precision and requires more effort and time. - Create 3-D Displays with Raster Data
This example shows how to create a 3-D display of raster data, where the z-coordinate represents the data values. Change the viewpoint to get the appearance of depth in the map.
精选示例
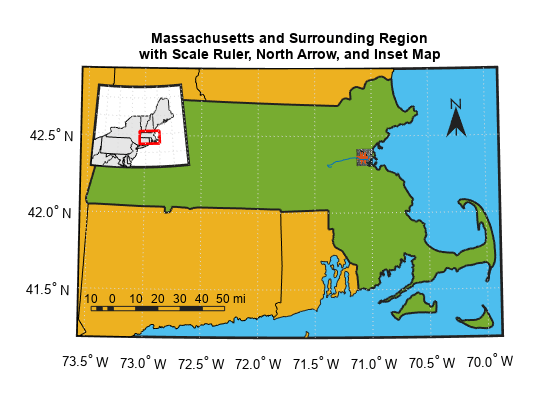
Create Map Displays with Geographic Data
Import geographic data with coordinates in latitude and longitude, display geographic data in a map display, and customize the display.
Create Maps with Data in Projected Coordinate Reference Systems
Create a map using multiple data sets with coordinates in geographic and projected coordinate reference systems.