数据平滑和离群值检测
此示例说明如何使用 smoothdata 函数通过数据平滑处理消除数据中不需要的噪声或行为。此示例还说明如何使用 isoutlier、filloutliers 或 rmoutliers 函数识别和处理离群值,这些离群值是与其余数据显著不同的数据点。您也可以使用实时编辑器中的平滑数据和清洗离群数据任务以交互方式平滑含噪数据并处理数据中的离群值。
移动窗方法
移动窗方法是分批处理数据的方式,通常是为了从统计角度表示数据中的相邻点。移动平均值是一种常见的数据平滑技术,它沿着数据滑动窗,同时计算每个窗内点的均值。这可以帮助消除从一个数据点到下一个数据点的非显著变化。
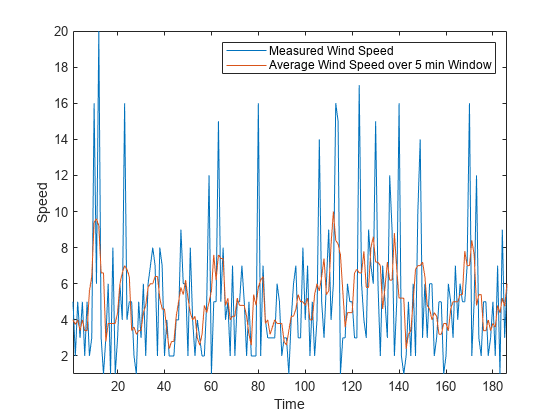
例如,假设每分钟测量一次风速,持续约 3 小时。使用 movmean 函数和 5 分钟的窗口大小可去除高速阵风。
load windData.mat
mins = 1:length(speed);
window = 5;
meanspeed = movmean(speed,window);
plot(mins,speed,mins,meanspeed)
axis tight
legend("Measured Wind Speed","Average Wind Speed over 5 min Window")
xlabel("Time")
ylabel("Speed")
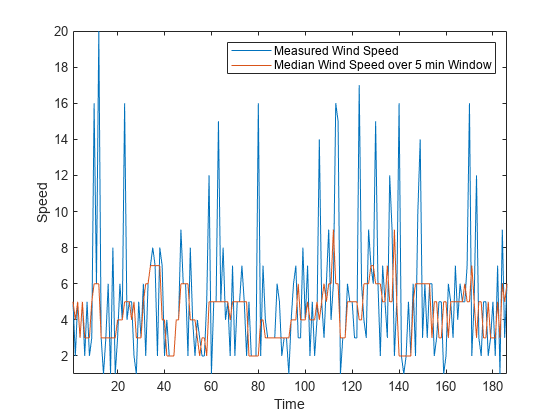
同样,您可以使用 movmedian 函数计算滑动窗中的风速中位数。
medianspeed = movmedian(speed,window);
plot(mins,speed,mins,medianspeed)
axis tight
legend("Measured Wind Speed","Median Wind Speed over 5 min Window")
xlabel("Time")
ylabel("Speed")
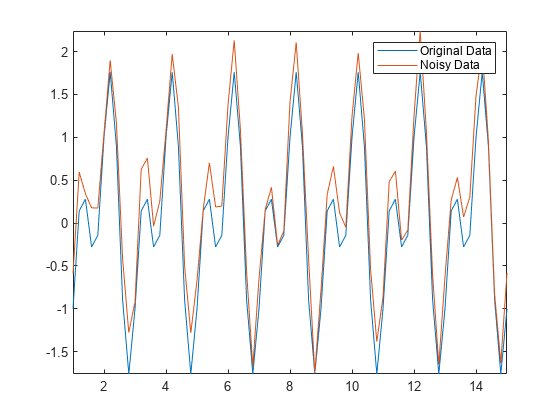
并非所有数据都适合用移动窗方法进行平滑处理。例如,创建插入了随机噪声的正弦信号。
t = 1:0.2:15;
A = sin(2*pi*t) + cos(2*pi*0.5*t);
Anoise = A + 0.5*rand(1,length(t));
plot(t,A,t,Anoise)
axis tight
legend("Original Data","Noisy Data")
使用移动均值和大小为 3 的窗口对含噪数据进行平滑处理。
window = 3;
Amean = movmean(Anoise,window);
plot(t,A,t,Amean)
axis tight
legend("Original Data","Moving Mean - Window Size 3")

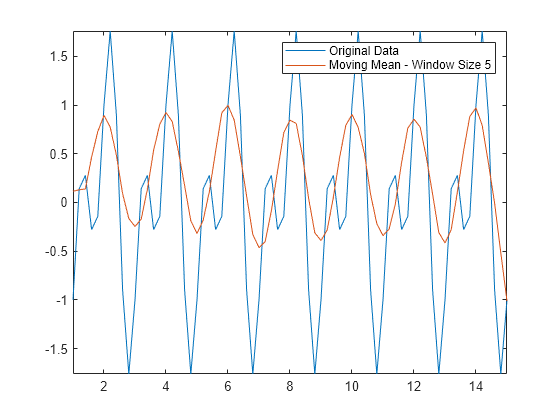
移动均值方法可获得数据的大致形状,但不能非常准确地捕获波谷(局部最小值)。由于波谷点在每个窗口中两个较大的邻点之间,因此均值不是那些点的理想逼近值。如果使窗口大小变大,均值将完全消除较短的波峰。对于这种类型的数据,您可能需要考虑其他平滑技术。
Amean = movmean(Anoise,5);
plot(t,A,t,Amean)
axis tight
legend("Original Data","Moving Mean - Window Size 5")
常见的平滑方法
smoothdata 函数提供几种平滑选项,如萨维茨基-戈雷方法,这是一种常用的信号处理平滑技术。默认情况下,smoothdata 根据数据为方法选择最佳估计窗口大小。
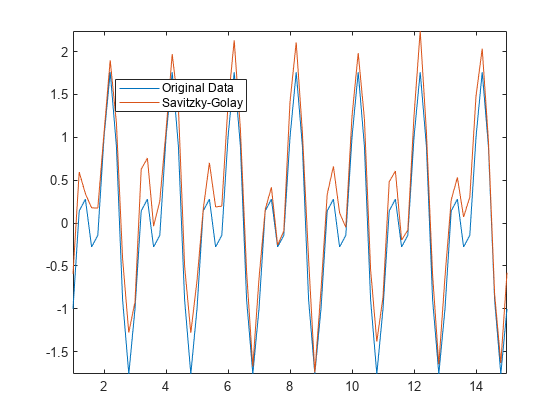
使用萨维茨基-戈雷方法可对含噪信号 Anoise 进行平滑处理,并输出它使用的窗口大小。与 movmean 相比,该方法可提供更好的波谷逼近值。
[Asgolay,window] = smoothdata(Anoise,"sgolay");
plot(t,A,t,Asgolay)
axis tight
legend("Original Data","Savitzky-Golay","location","best")
window
window =
3
稳健的 Lowess 方法是另一种平滑方法,尤其适用于含噪数据还包含离群值的情形。在含噪数据中插入离群值,并使用稳健的 Lowess 方法对数据进行平滑处理,从而消除离群值。
Anoise(36) = 20;
Arlowess = smoothdata(Anoise,"rlowess",5);
plot(t,Anoise,t,Arlowess)
axis tight
legend("Noisy Data","Robust Lowess")

检测离群值
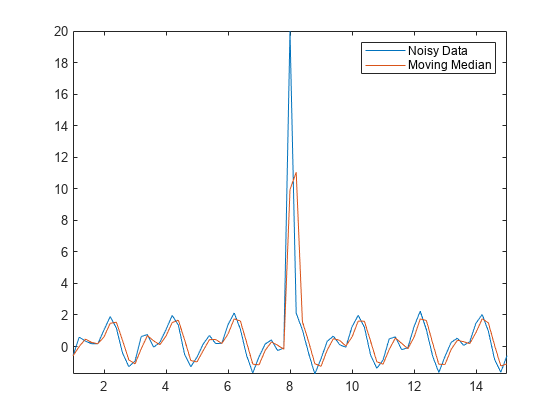
数据中的离群值可能使数据处理结果和其他计算量严重失真。例如,如果您尝试用移动平均值方法对包含离群值的数据进行平滑处理,则可能得到误导性的波峰或波谷。
Amedian = smoothdata(Anoise,"movmedian");
plot(t,Anoise,t,Amedian)
axis tight
legend("Noisy Data","Moving Median")
当检测到离群值时,isoutlier 函数返回逻辑值 1。验证 Anoise 中离群值的索引和值。
TF = isoutlier(Anoise);
ind = find(TF)
ind =
36
Aoutlier = Anoise(ind)
Aoutlier =
20
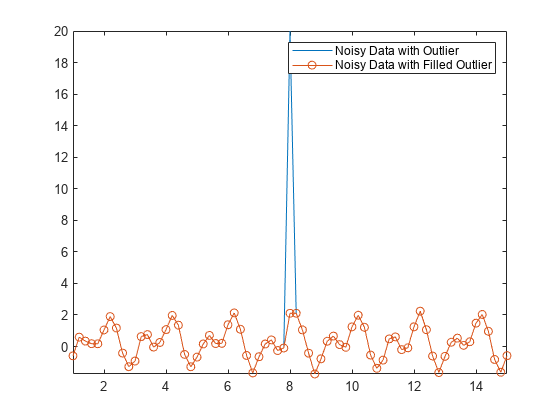
您可以使用 filloutliers 函数并指定填充方法来替换数据中的离群值。例如,用紧挨 Anoise 中离群值右侧的邻点值填充该离群值。
Afill = filloutliers(Anoise,"next");
plot(t,Anoise,t,Afill,"o-")
axis tight
legend("Noisy Data with Outlier","Noisy Data with Filled Outlier")
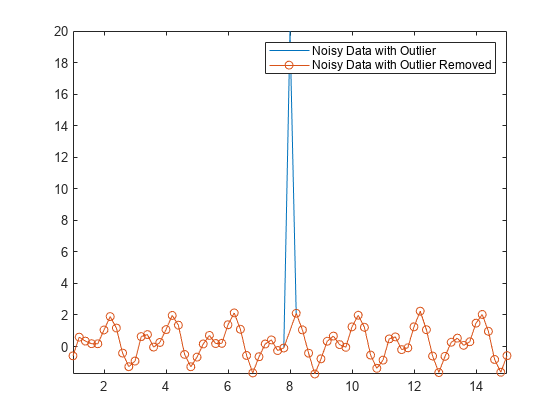
您也可以使用 rmoutliers 函数从数据中删除离群值。例如,删除 Anoise 中的离群值。
Aremove = rmoutliers(Anoise);
plot(t,Anoise,t(~TF),Aremove,"o-")
axis tight
legend("Noisy Data with Outlier","Noisy Data with Outlier Removed")
非均匀数据
并非所有数据都由等间距点组成,这会影响数据处理的方法。创建一个 datetime 向量,其中包含 Airreg 中数据的不规则采样时间。time 向量表示了前 30 分钟内每分钟采集一次的样本和两天内每小时采集一次的样本。
t0 = datetime(2014,1,1,1,1,1);
timeminutes = sort(t0 + minutes(1:30));
timehours = t0 + hours(1:48);
time = [timeminutes timehours];
Airreg = rand(1,length(time));
plot(time,Airreg)
axis tight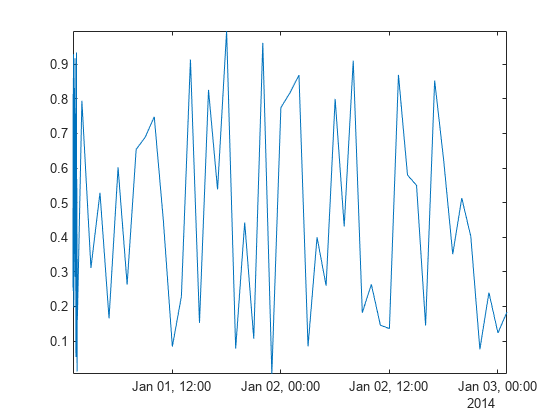
默认情况下,smoothdata 按照等间距整数进行平滑处理,在本例中为 1,2,...,78。由于整数时间戳与 Airreg 中各点的采样不协调,前半小时的数据在平滑后仍然出现噪声。
Adefault = smoothdata(Airreg,"movmean",3);
plot(time,Airreg,time,Adefault)
axis tight
legend("Original Data","Smoothed Data with Default Sample Points")

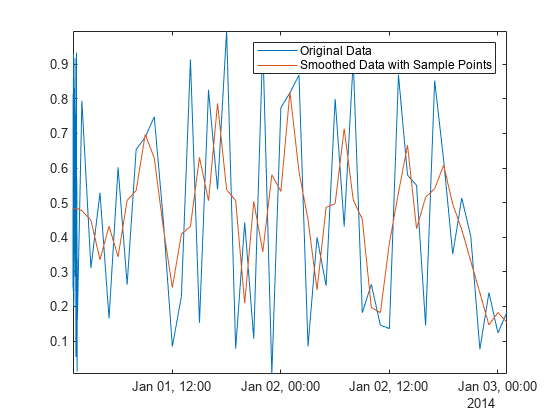
MATLAB® 中的许多数据处理函数(包括 smoothdata、movmean 和 filloutliers)允许您提供样本点,从而确保相对于其采样单位和频率处理数据。要消除 Airreg 中前半小时数据的高频变化,请将 SamplePoints 名称-值参量和 time 中的时间戳结合使用。
Asamplepoints = smoothdata(Airreg,"movmean", ...
    hours(3),"SamplePoints",time);
plot(time,Airreg,time,Asamplepoints)
axis tight
legend("Original Data","Smoothed Data with Sample Points")
另请参阅
函数
smoothdata|isoutlier|filloutliers|rmoutliers|movmean|movmedian