数值数据的积分
此示例显示如何对一组离散速度数据进行数值积分以逼近行驶距离。integral 族仅接受函数句柄输入,所以这些函数不能用于离散数据集。当函数表达式不能用于积分时,使用 trapz 或 cumtrapz。
查看速度数据
考虑以下速度数据和相应的时间数据。
vel = [0 .45 1.79 4.02 7.15 11.18 16.09 21.90 29.05 29.05 ...
29.05 29.05 29.05 22.42 17.9 17.9 17.9 17.9 14.34 11.01 ...
8.9 6.54 2.03 0.55 0];
time = 0:24;
这些数据代表汽车的速度(米/秒),间隔为 1 秒,时间超过 24 秒。
绘制速度数据点并将各点用直线连接。
figure
plot(time,vel,'-*')
grid on
title('Automobile Velocity')
xlabel('Time (s)')
ylabel('Velocity (m/s)')
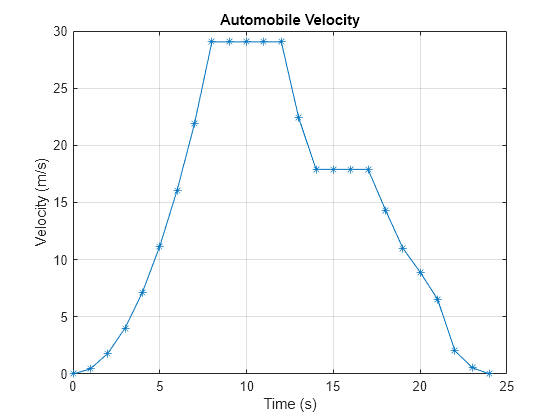
斜率在加速时为正,恒速时为零,减速时为负。在 t = 0 的时间点,车辆处于静止,速度为 vel(1) = 0 米/秒。然后车辆以 vel(9) = 29.05 米/秒的速度加速,并在 t = 8 秒内达到最大速度,并保持这种速度 4 秒的时间。然后车辆在 3 秒之内减速到 vel(14) = 17.9 米/秒并最终静止。由于这个速度曲线有多处不连续,因此不能用单一连续函数来描述。
计算总行驶距离
trapz 使用数据点进行离散积分以创建梯形,所以它非常适合处理不连续的数据集。这种方法假设在数据点之间为线性行为,当数据点之间的行为是非线性时,精度可能会降低。为了说明这一点,可将数据点作为顶点在图表上画出梯形。
xverts = [time(1:end-1); time(1:end-1); time(2:end); time(2:end)];
yverts = [zeros(1,24); vel(1:end-1); vel(2:end); zeros(1,24)];
p = patch(xverts,yverts,'b','LineWidth',1.5);
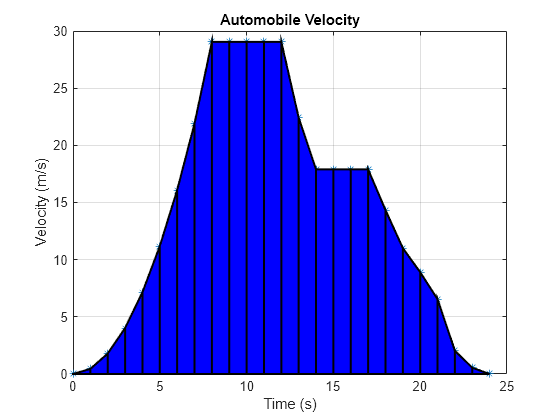
trapz 可通过将区域分解成梯形来计算离散数据集下的面积。然后,函数将每个梯形面积累加来计算总面积。
通过使用 trapz 求速度数据积分来计算汽车的总行驶距离(对应的着色区域)。默认情况下,如果使用语法 trapz(Y),则假定点之间的间距为 1。但是,您可以使用语法 trapz(X,Y) 指定不同的均匀或非均匀间距 X。在这种情况下,time 向量中读数之间的间距是 1,因此可以使用默认间距。
distance = trapz(vel)
distance =
345.2200
汽车在 t = 24 秒内行驶的距离约为 345.22 米。
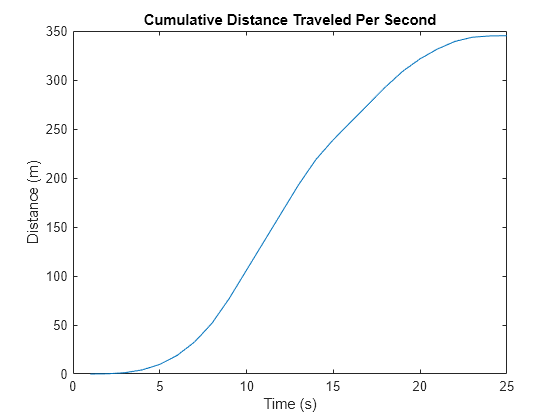
绘制累积行驶距离
cumtrapz 函数与 trapz 密切相关。trapz 仅返回最终的积分值,而 cumtrapz 还在向量中返回中间值。
计算累积行驶距离并绘制结果。
cdistance = cumtrapz(vel);
T = table(time',cdistance','VariableNames',{'Time','CumulativeDistance'})
T=25×2 table
    Time    CumulativeDistance
    ____    __________________

      0                0
      1            0.225
      2            1.345
      3             4.25
      4            9.835
      5               19
      6           32.635
      7            51.63
      8           77.105
      9           106.15
     10            135.2
     11           164.25
     12           193.31
     13           219.04
     14            239.2
     15            257.1
      ⋮
plot(cdistance)
title('Cumulative Distance Traveled Per Second')
xlabel('Time (s)')
ylabel('Distance (m)')