shortestpathtree
Shortest path tree from node
Syntax
Description
returns a directed graph, TR
= shortestpathtree(G
,s
)TR
, that contains the tree of shortest
paths from source node s
to all other nodes in the graph. If the
graph is weighted (that is, G.Edges
contains a variable
Weight
), then those weights are used as the distances along
the edges in the graph. Otherwise, all edge distances are taken to be
1
.
uses additional options specified by one or more Name-Value pair arguments, using
any of the input argument combinations in previous syntaxes. For example,
TR
= shortestpathtree(___,Name,Value
)shortestpathtree(G,s,'OutputForm','vector')
returns a numeric
vector that describes the shortest path tree.
Examples
Shortest Paths from Specified Source Node
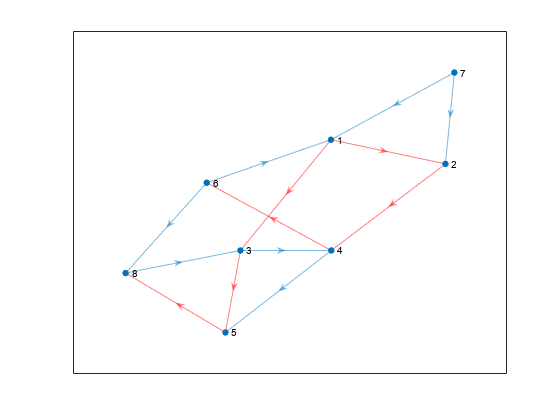
Find the shortest paths from a source node to each of the other reachable nodes in a graph, and plot the results.
Create a directed graph.
s = [1 1 2 3 3 4 4 6 6 7 8 7 5]; t = [2 3 4 4 5 5 6 1 8 1 3 2 8]; G = digraph(s,t)
G = digraph with properties: Edges: [13x1 table] Nodes: [8x0 table]
Calculate the shortest paths from node 1 to each of the other reachable nodes in the graph. Then, plot the resulting tree on top of the graph.
TR = shortestpathtree(G,1); p = plot(G); highlight(p,TR,'EdgeColor','r')
Since there is no path from node 1 to node 7, node 7 is disconnected from the tree.
Shortest Paths to Specified Target Node
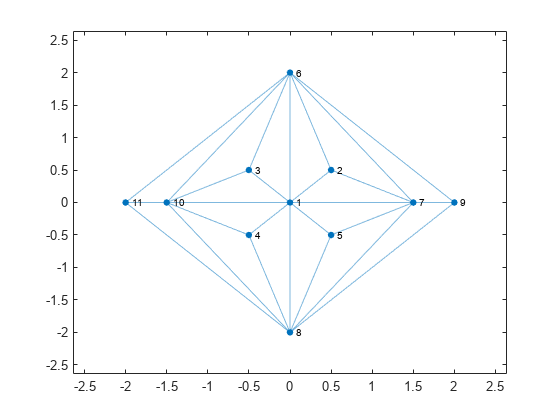
Find the shortest paths from each node in a graph to a target node, and plot the results.
Create and plot a graph.
s = [1 1 1 1 1 1 1 2 2 7 7 7 7 9 9 3 3 1 6 4 8 10 6 8 4 5]; t = [2 3 4 5 6 8 7 6 7 5 6 8 9 6 8 6 10 10 10 10 10 11 11 11 8 8]; G = graph(s,t); x = [0 0.5 -0.5 -0.5 0.5 0 1.5 0 2 -1.5 -2]; y = [0 0.5 0.5 -0.5 -0.5 2 0 -2 0 0 0]; plot(G,'XData',x,'YData',y)
Find the shortest paths from each node in the graph to node 10. Plot the resulting tree.
TR = shortestpathtree(G,'all',10);
plot(TR)
Subset of Shortest Paths with Specified Source Node
Find the shortest paths and path lengths from a single source node to several target nodes.
Create and plot a graph.
G = digraph(bucky); plot(G)
Find the shortest paths from node 23 to several other nodes. Specify OutputForm
as cell
to return the shortest paths in a cell array. Specify two outputs to also return the shortest path distances.
target = [1 5 13 32 44]; [TR,D] = shortestpathtree(G,23,target,'OutputForm','cell')
TR=5×1 cell array
{[ 23 22 21 4 5 1]}
{[ 23 22 21 4 5]}
{[23 22 20 16 17 15 14 13]}
{[ 23 22 20 19 18 32]}
{[ 23 24 48 47 46 44]}
D = 1×5
5 4 7 5 5
tree{j}
is the shortest path from node 23 to node target(j)
with length D(j)
.
Find the path and path length from node 21 to node 5.
path = TR{2}
path = 1×5
23 22 21 4 5
path_length = D(2)
path_length = 4
Input Arguments
s
— Source node(s)
node indices | node names | 'all'
Source node(s), specified as one or more node indices or node names, or as
all nodes in the graph with 'all'
.
When used alone,
s
must specify a single source node.When used together with
t
, thes
andt
inputs must satisfy:s
can be a single source node, andt
can specify multiple target nodes.s
can specify several source nodes, andt
can specify a single target node.
This table shows the different ways to refer to one or more nodes either by their numeric node indices or by their node names.
Form | Single Node | Multiple Nodes |
---|---|---|
Node index | Scalar Example: | Vector Example: |
Node name | Character vector Example: | Cell array of character vectors Example: |
String scalar Example: | String array Example: |
s
must not specify the node name
'all'
, since this node name conflicts with an option
name. Use findnode
to instead pass in the node index for
this case.
Example: shortestpathtree(G,'a')
Example: shortestpathtree(G,[1 2 3],8)
t
— Target node(s)
'all'
(default) | node indices | node names
Target node(s), specified as one or more node indices or node names, or as
all nodes in the graph with 'all'
.
The s
and t
inputs must
satisfy:
s
can be a single source node, andt
can specify multiple target nodes.s
can specify several source nodes, andt
can specify a single target node.
t
must not specify nodes named
'all'
, 'Method'
, or
'OutputForm'
, since these node names conflict with
option names. Use findnode
to instead pass in the node
index for these cases.
Example: shortestpathtree(G,[1 2 3],8)
Example: shortestpathtree(G,{'a','b','c'},{'f'})
Name-Value Arguments
Specify optional pairs of arguments as
Name1=Value1,...,NameN=ValueN
, where Name
is
the argument name and Value
is the corresponding value.
Name-value arguments must appear after other arguments, but the order of the
pairs does not matter.
Before R2021a, use commas to separate each name and value, and enclose
Name
in quotes.
Example: [TR,D] =
shortestpathtree(G,s,t,'Method','unweighted','OutputForm','vector')
OutputForm
— Format of output
'tree'
(default) | 'cell'
| 'vector'
Format of output, specified as the comma-separated pair consisting of
'OutputForm'
and one of the options in the
table.
Option | Description |
---|---|
'tree' (default) |
|
'cell' |
If If specified, the third output
|
'vector' |
In each case
If specified, the third output
|
Example: shortestpathtree(G,s,'OutputForm','vector')
Method
— Shortest path algorithm
'auto'
(default) | 'unweighted'
| 'positive'
| 'mixed'
| 'acyclic'
Shortest path algorithm, specified as the comma-separated pair
consisting of 'Method'
and one of the options in the
table.
Option | Description |
---|---|
'auto' (default) |
The
|
'unweighted' |
Breadth-First computation that treats all edge
weights as |
'positive' |
Dijkstra algorithm that requires all edge weights to be nonnegative. |
'mixed' (only for
digraph ) |
Bellman-Ford algorithm for directed graphs that requires the graph to have no negative cycles. While |
'acyclic' (only for
digraph ) |
Algorithm designed to improve performance for directed, acyclic graphs (DAGs) with weighted edges. Use |
Note
For most graphs, 'unweighted'
is the fastest
algorithm, followed by 'acyclic'
,
'positive'
, and
'mixed'
.
Example: shortestpath(G,s,t,'Method','acyclic')
Output Arguments
TR
— Shortest path tree
digraph
object (default) | cell array | vector
Shortest path tree, returned as a digraph
object, cell
array, or vector, depending on the value of 'OutputForm'
. Use
the highlight
function to
visualize the shortest path tree on top of a plot of the graph, or use
plot(TR)
to visualize the shortest path tree on its
own.
If there are multiple shortest paths between two nodes, then
TR
contains only one of the paths. The path that is
returned can change depending on which algorithm is specified by
Method
. The TR
output is a graph
with zero edges if there are no paths connecting any of the specified
nodes.
D
— Distance between source and target nodes
vector
Distance between source and target nodes, returned as a vector. A value of
Inf
indicates there is no path between two
nodes.
E
— Edges in tree or on path
logical vector (default) | cell array | vector
Edges in tree or on path, returned as a logical vector, cell array, or
vector, depending on the value of 'OutputForm'
:
If you don't specify
'OutputForm'
or specify a value of'tree'
, thenE
is a logical vector indicating whether each graph edge is in directed graphTR
. This output is compatible with the'Edges'
name-value pair ofhighlight
, for example:highlight(p,'Edges',E)
.If
'OutputForm'
is'cell'
, thenE
is a cell array containing the edges on the corresponding paths inTR
.If
'OutputForm'
is'vector'
, thenE
is a vector which, for each node, gives the index of the edge connecting it to its parent node in the shortest path tree.
Tips
The
shortestpath
,shortestpathtree
, anddistances
functions do not support undirected graphs with negative edge weights, or more generally any graph containing a negative cycle, for these reasons:A negative cycle is a path that leads from a node back to itself, with the sum of the edge weights on the path being negative. If a negative cycle is on a path between two nodes, then no shortest path exists between the nodes, since a shorter path can always be found by traversing the negative cycle.
A single negative edge weight in an undirected graph creates a negative cycle.
Extended Capabilities
Thread-Based Environment
Run code in the background using MATLAB® backgroundPool
or accelerate code with Parallel Computing Toolbox™ ThreadPool
.
Version History
Introduced in R2015b
See Also
shortestpath
| distances
| nearest
| graph
| digraph
MATLAB Command
You clicked a link that corresponds to this MATLAB command:
Run the command by entering it in the MATLAB Command Window. Web browsers do not support MATLAB commands.
Select a Web Site
Choose a web site to get translated content where available and see local events and offers. Based on your location, we recommend that you select: .
You can also select a web site from the following list
How to Get Best Site Performance
Select the China site (in Chinese or English) for best site performance. Other MathWorks country sites are not optimized for visits from your location.
Americas
- América Latina (Español)
- Canada (English)
- United States (English)
Europe
- Belgium (English)
- Denmark (English)
- Deutschland (Deutsch)
- España (Español)
- Finland (English)
- France (Français)
- Ireland (English)
- Italia (Italiano)
- Luxembourg (English)
- Netherlands (English)
- Norway (English)
- Österreich (Deutsch)
- Portugal (English)
- Sweden (English)
- Switzerland
- United Kingdom (English)
Asia Pacific
- Australia (English)
- India (English)
- New Zealand (English)
- 中国
- 日本Japanese (日本語)
- 한국Korean (한국어)