scroll
R2026b滚动到 UI 组件内的位置
语法
描述
示例
滚动到在使用 uifigure 函数创建的图窗中的指定 (x,y) 坐标。
创建一个图窗,并将 Scrollable 属性设置为 'on'。然后添加五个子组件。为确保图窗可滚动,将第一个组件放在图窗上边缘的上方。然后使各组件的间隔足够远,以使它们不能一起放入图窗中。
% Create figure
fig = uifigure('Name','Customer','Scrollable','on');
fig.Position = [100 100 493 283];

% Title label
title = uilabel(fig,'Text','Customer Record');
title.FontSize = 18;
title.FontWeight = 'bold';
title.Position = [173 315 157 22];

% Name
name = uieditfield(fig,'text');
name.Position = [169 239 173 22];
namelabel = uilabel(fig,'Text','Name','HorizontalAlignment','right');
namelabel.Position = [116 239 38 22];

% Phone
phone = uieditfield(fig,'text');
phone.Position = [169 164 173 22];
phonelabel = uilabel(fig,'Text','Phone','HorizontalAlignment','right');
phonelabel.Position = [114 164 40 22];

% Balance
balance = uieditfield(fig,'numeric');
balance.Position = [169 89 173 22];
balancelabel = uilabel(fig,'Text','Balance','HorizontalAlignment','right');
balancelabel.Position = [105 89 49 22];

% Submit button
button = uibutton(fig,'push','Text','Submit');
button.Position = [169 14 173 22];
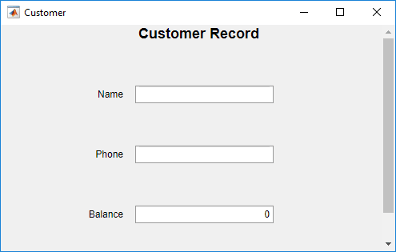
默认情况下,MATLAB® 会滚动到包含子组件的区域的左上角。
滚动到位置 (1,1),这是图窗的底部。
scroll(fig,1,1)
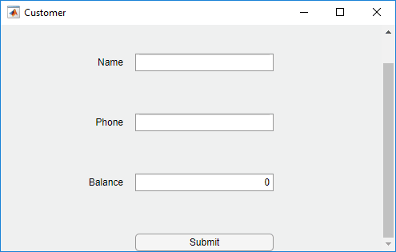
通过指定像素坐标或位置名称,以显示可滚动网格布局的子组件。
创建一个 5×2 网格布局,并将网格的 Scrollable 属性设置为 'on'。然后在该网格中添加一个标签、一个表和一个面板。将面板的 Scrollable 属性设置为 'off',然后向面板添加一个图。
fig = uifigure(Position=[782 497 435 311]);
g = uigridlayout(fig,Scrollable="on");
g.RowHeight = [22 40 22 22 400];
g.ColumnWidth = [400 400];

lbl = uilabel(g,Text="Tsunamis");
lbl.Layout.Row = 2;
lbl.Layout.Column = [1 2];
lbl.HorizontalAlignment = "center";
lbl.FontSize = 28;

tsunamis = readtable('tsunamis.xlsx');
tsunamis.Cause = categorical(tsunamis.Cause);
t = uitable(g,Data=tsunamis);
t.Layout.Row = [3 5];
t.Layout.Column = 2;

p = uipanel(g);
p.Scrollable = "off";
p.Layout.Row = [3 5];
p.Layout.Column = 1;
gb = geobubble(p,tsunamis.Latitude,tsunamis.Longitude,...
    tsunamis.MaxHeight,tsunamis.Cause);

滚动到网格中的一个位置。
scroll(g,100,-30)

现在使用位置名称滚动到网格的右下角。
scroll(g,"bottom","right")

通过将组件指定为滚动位置,将其显示在视图中。
创建一个包含两个下拉组件、一个列表框和一个表的图窗。定位组件,使它们无法同时显示在图窗中。
fig = uifigure;
fig.Scrollable = 'on';
fig.Position = [100 300 328 110];

dd1 = uidropdown(fig);
dd1.Position = [20 360 120 22];

dd2 = uidropdown(fig);
dd2.Position = [20 200 120 22];

lb = uilistbox(fig);
lb.Position = [230 300 120 80];

t = readtable('patients.xls');
uit = uitable(fig,'Data',t);
uit.Position = [375 100 300 300];
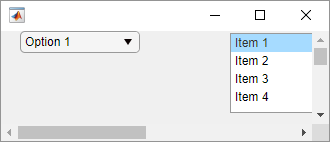
滚动到表。
scroll(fig,uit)

以编程方式滚动到文本区域的底部。
创建一个文本区域。为其指定大小和长文本。
fig = uifigure;
txa = uitextarea(fig);
txa.Position = [100 100 80 80];
txa.Value = "Lorem ipsum dolor sit amet, consectetur adipiscing elit, sed do eiusmod tempor.";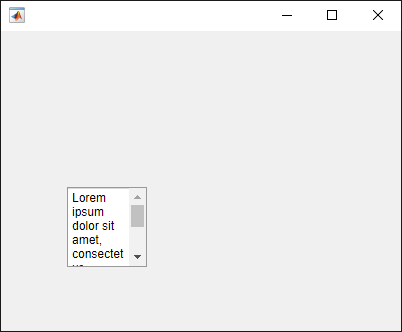
滚动到文本区域的底部。
scroll(txa,"bottom")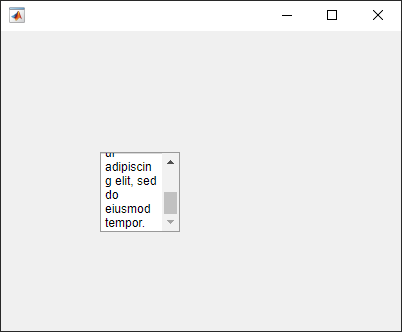
通过在列表框中指定某个项,使该项显示在视图中。
创建一个列表框,其中包含与 ItemsData 相关的名称列表。
fig = uifigure('Position',[680 678 300 200]);
list = uilistbox(fig, 'Position',[70 50, 150 78]);
list.Items = {'Diane Fitzsimmons', 'Naomi Becker', 'Nick Stewart',...
           'Alex Bradford', 'Caroline Eliot', 'Leslie Bond', ...
           'Aaron Silberlicht', 'Ramu Sadasiv', 'Joyce Wu',...
           'Ann Shanahan'};
list.ItemsData = [1 2 3 4 5 6 7 8 9 10];
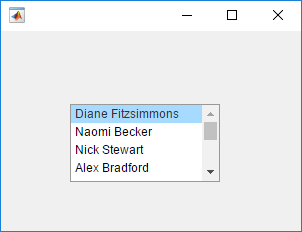
滚动到 Caroline Eliot。
scroll(list,'Caroline Eliot')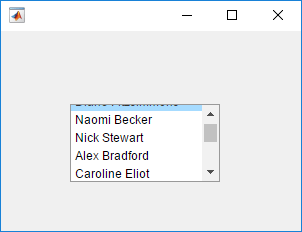
通过将 Value 属性设置为 ItemsData 属性中的对应元素来选择 Caroline Eliot。
list.Value = 5;

通过指定 TreeNode 对象使某个树节点显示在视图中。
创建一个树,其中包含四个顶层节点,每个顶层节点又包含子节点。
fig = uifigure;
tree = uitree(fig,'Position',[20 20 175 100]);

% First level nodes
category1 = uitreenode(tree,'Text','Runners');
category2 = uitreenode(tree,'Text','Cyclists');
category3 = uitreenode(tree,'Text','Hikers');
category4 = uitreenode(tree,'Text','Swimmers');

% Second level nodes
r1 = uitreenode(category1,'Text','Joe');
r2 = uitreenode(category1,'Text','Linda');
c1 = uitreenode(category2,'Text','Rajeev');
h1 = uitreenode(category3,'Text','Jack');
s1 = uitreenode(category4,'Text','Logan');
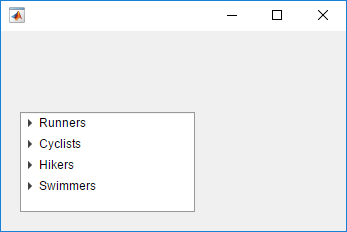
展开节点,使 Swimmers 滚动到视图之外。
expand(tree)
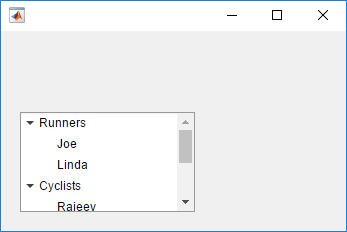
滚动到 Swimmers 节点。
scroll(tree,category4)

通过设置 Tree 对象的 SelectedNodes 属性来选择 Swimmers 节点。
tree.SelectedNodes = category4;

将样本患者数据以表数组形式读入工作区。然后,创建一个表 UI 组件来显示数据。
tdata = readtable("patients.xls");
vars = ["Age" "Systolic" "Diastolic" "Smoker"];
tdata = tdata(1:40,vars);

fig = uifigure;
uit = uitable(fig,Data=tdata);
uit.RowName = "numbered";
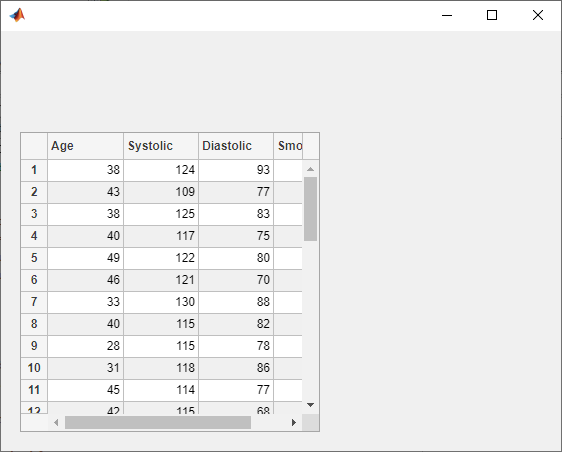
滚动到表的第 25 行。
scroll(uit,"row",25)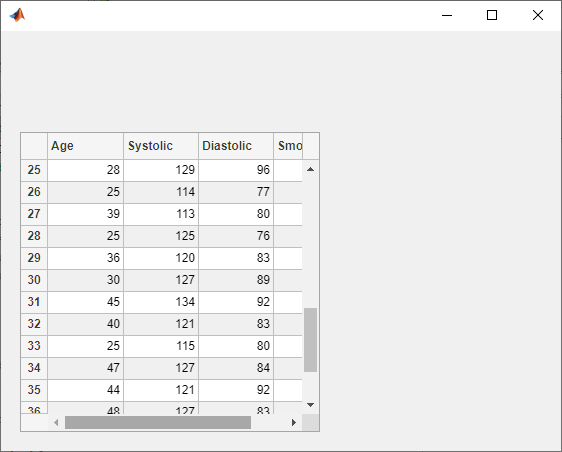
输入参数
详细信息
版本历史记录
在 R2016a 中推出另请参阅
函数
uifigure|uigridlayout|uitextarea|uitree|uitreenode|uilistbox|uitable|isInScrollView

