uistyle
为 UI 组件创建样式
说明
s = uistyle 为表、树、列表框或下拉 UI 组件创建空样式并返回 Style 对象。使用 Style 对象为表中的单元格、树中的节点以及列表框和下拉组件中的项目创建可视样式。使用以下语法创建一个样式,稍后会向其添加属性。
s = uistyle( 通过使用一个或多个名称-值参量来指定 Name,Value)Style 属性值。例如,uistyle("BackgroundColor","g") 创建一个背景颜色为绿色的样式。
示例
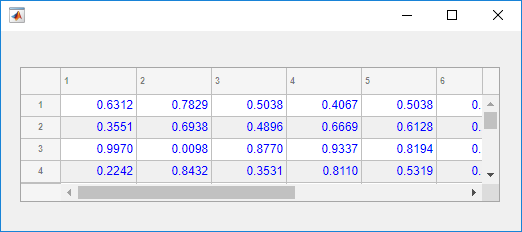
通过创建样式并将其应用于表来更改表列中单元格的背景颜色。
创建一个包含表 UI 组件的图窗,并用数值数据填充表。
fig = uifigure;
fig.Position = [500 500 520 220];
uit = uitable(fig);
uit.Data = rand(5);
uit.Position = [20 30 480 135];

然后,创建一个具有特定背景颜色的样式,并使用 addStyle 函数将该样式添加到表的第二列。
s = uistyle("BackgroundColor","red");
addStyle(uit,s,"column",2)
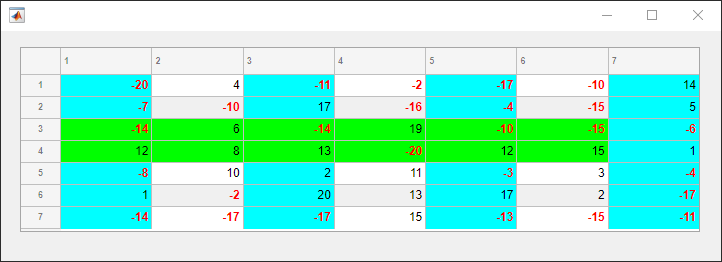
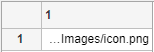
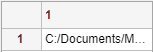
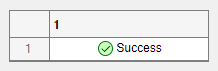
创建一些列出文件的路径及其加载状态的示例表数据。
DataFiles = ["C:/Documents/MyProject/MyData/file1.mat"; ...
    "C:/Documents/MyProject/MyData/file2.mat"; ...
    "C:/Documents/MyProject/MyData/file3.mat"];
LoadStatus = ["Success";"Success";"Failure"];
T = table(DataFiles,LoadStatus);
在 UI 图窗的表 UI 组件中显示表数据。
fig = uifigure("Position",[500 500 400 350]);
t = uitable(fig,"Data",T,"ColumnWidth",{'2x','1x'});
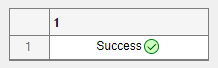
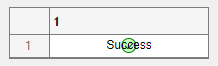
创建三个样式:一个指定在左侧裁剪长文本,一个具有指示成功的图标,一个具有指示错误的图标。这两种图标样式还指定图标在表单元格的最右边距对齐。
sClip = uistyle("HorizontalClipping","left");
sPass = uistyle("Icon","success","IconAlignment","rightmargin");
sFail = uistyle("Icon","error","IconAlignment","rightmargin");
将这三个样式应用于表 UI 组件的不同部分。将第一个样式应用于第一列,使示例文件名可见;将第二个和第三个样式应用于第二列中的单元格,以直观指示文件的加载状态。
addStyle(t,sClip,"column",1)
addStyle(t,sPass,"cell",[1 2;2 2])
addStyle(t,sFail,"cell",[3 2])
![]()
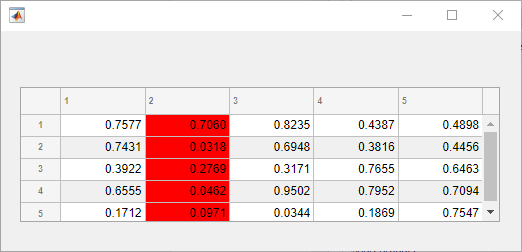
使用 MATLAB® 文档中的页创建一些示例表数据。对于每个页,使用 HTML 标记指定页的链接和一些可运行的 MATLAB 代码。
Page = ["<a href='https://www.mathworks.com/help/matlab/gui-development.html'>App Building</a>"; ...
    "<a href='https://www.mathworks.com/help/matlab/graphics.html'>Graphics</a>"; ...
    "<a href='https://www.mathworks.com/help/matlab/mathematics.html'>Mathematics</a>"];
Example = ["<a href='matlab:uibutton'>Run Code</a>";
    "<a href='matlab:plot(1:10)'>Run Code</a>";
    "<a href='matlab:disp(pi)'>Run Code</a>"];
T = table(Page,Example);
在 UI 图窗的表 UI 组件中显示表数据。
fig = uifigure("Position",[500 500 350 350]);
tbl = uitable(fig,"Data",T);
创建一个指定将文本解释为 HTML 标记的样式。将此样式应用于整个 UI 表。
s = uistyle("Interpreter","html");
addStyle(tbl,s);
点击 Page 列中的链接以在 Web 浏览器中打开文档。点击 Examples 列中的链接以运行 MATLAB 中的示例代码。
有关创建执行命令的链接的详细信息,请参阅创建运行函数的超链接。
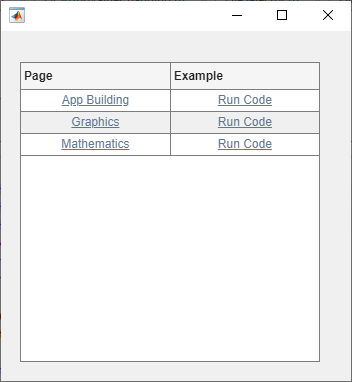
创建多个样式并将它们添加到表 UI 组件的不同部分。
创建一个包含表 UI 组件的图窗并显示表中的数值数据。找到表中其值小于零的元素的行和列下标,以便稍后设置这些单元格的样式。
fig = uifigure;
fig.Position = [500 500 720 230];

uit = uitable(fig);
uit.Data = randi([-20,20],7);
uit.Position = [20 30 680 185];

[row,col] = find(uit.Data < 0);
创建两个背景颜色样式和一个指定字体颜色和粗细的样式。为第 1 列、第 3 列和第 5 列添加青色背景颜色。将具有负值的单元格的字体设为红色和粗体以示强调。然后,将第 3 行和第 4 行的背景颜色设为绿色。最后,对第 7 列重复使用青色背景颜色。对于添加了同一类型的多个样式的单元格,最后添加的样式将成为单元格中显示的样式。例如,最后一列的第 3 行和第 4 行具有青色背景,这对应于添加到这些单元格的最后一个样式。
s1 = uistyle;
s1.BackgroundColor = "cyan";
addStyle(uit,s1,"column",[1 3 5])

s2 = uistyle;
s2.FontColor = "red";
s2.FontWeight = "bold";
addStyle(uit,s2,"cell",[row,col])

s3 = uistyle;
s3.BackgroundColor = "green";
addStyle(uit,s3,"row",[3 4])

addStyle(uit,s1,"column",7)
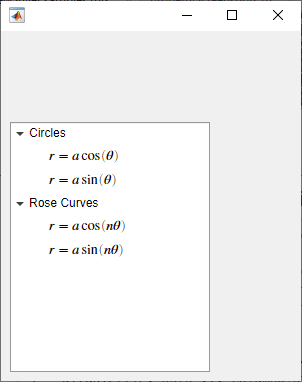
在 UI 图窗中创建一个树 UI 组件。添加显示两种类型的极坐标图的方程的树节点。使用 LaTeX 标记指定树节点文本。然后,展开树中的所有节点。
fig = uifigure("Position",[500 500 300 350]);
tr = uitree(fig,"Position",[10 10 200 250]);
n1 = uitreenode(tr,Text="Circles");
n2 = uitreenode(tr,Text="Rose Curves");
n11 = uitreenode(n1,Text="$$r=a\cos(\theta)$$");
n12 = uitreenode(n1,Text="$$r=a\sin(\theta)$$");
n21 = uitreenode(n2,Text="$$r=a\cos(n\theta)$$");
n22 = uitreenode(n2,Text="$$r=a\sin(n\theta)$$");

expand(tr)
创建一个指定将文本解释为 LaTeX 标记的样式。将此样式应用于树中作为顶层节点的子节点的所有节点。
s = uistyle("Interpreter","latex");
addStyle(tr,s,"level",2);
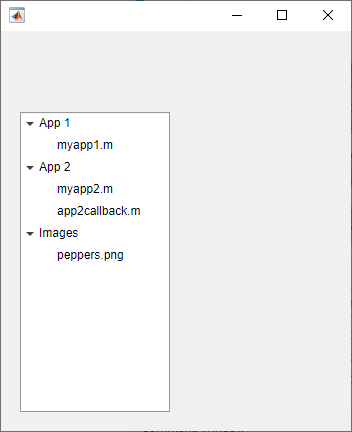
为显示文件结构的树节点添加样式,以便在视觉上区分不同文件类型。
创建一个树 UI 组件。每个顶层节点表示一个文件夹。每个子节点表示该文件夹中的一个文件。展开树以查看所有节点。
fig = uifigure("Position",[300 300 350 400]);
t = uitree(fig);

% Parent nodes
n1 = uitreenode(t,"Text","App 1");
n2 = uitreenode(t,"Text","App 2");
n3 = uitreenode(t,"Text","Images");

% Child nodes
n11 = uitreenode(n1,"Text","myapp1.m");
n21 = uitreenode(n2,"Text","myapp2.m");
n22 = uitreenode(n2,"Text","app2callback.m");
n31 = uitreenode(n3,"Text","peppers.png");

expand(t)
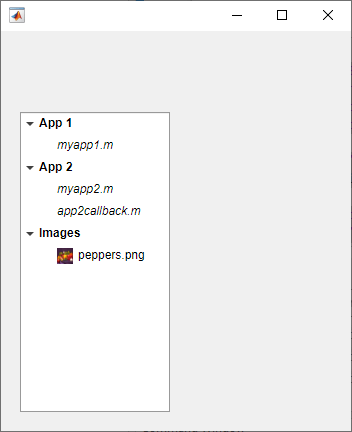
创建三个样式:一个具有加粗字体,一个具有倾斜字体角度,一个具有图标。
dirStyle = uistyle("FontWeight","bold");
mStyle = uistyle("FontAngle","italic");
imgStyle = uistyle("Icon","peppers.png");
将粗体样式应用于顶层节点,以区分表示文件夹的节点。将斜体样式应用于 App 1 和 App 2 节点的子节点,以区分表示 MATLAB 程序文件的节点。最后,将图标样式应用于表示一个图像文件的节点,以显示该图像的预览。
addStyle(t,dirStyle,"level",1)
addStyle(t,mStyle,"node",[n1.Children;n2.Children])
addStyle(t,imgStyle,"node",n31)
自 R2023a 起
创建一个列表框,其中包含三个表示不同图像的项目。
fig = uifigure;
lb = uilistbox(fig,"Items",["Peppers","Nebula","Street"]);
用对应于列表框项目的图标创建三个样式。
s1 = uistyle("Icon","peppers.png");
s2 = uistyle("Icon","ngc6543a.jpg");
s3 = uistyle("Icon","street1.jpg");
向列表框项目添加样式以显示图标。
addStyle(lb,s1,"item",1);
addStyle(lb,s2,"item",2);
addStyle(lb,s3,"item",3);
![]()
自 R2023a 起
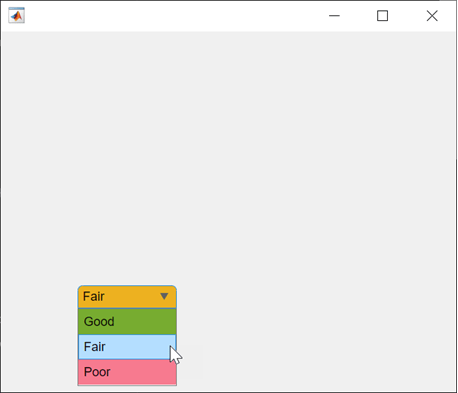
创建一个包含三个项的下拉 UI 组件。
fig = uifigure;
dd = uidropdown(fig,"Items",["Good","Fair","Poor"]);
创建三个背景颜色样式。
s1 = uistyle("BackgroundColor","#77AC30");
s2 = uistyle("BackgroundColor","#EDB120");
s3 = uistyle("BackgroundColor","#F77A8F");
将样式添加到下拉组件项中以更改其背景颜色。
addStyle(dd,s1,"item",1);
addStyle(dd,s2,"item",2);
addStyle(dd,s3,"item",3);
项目背景颜色会更新,组件的外观会反映所选项的样式。当用户指向某个项时,该样式不会更改显示的颜色。
名称-值参数
将可选参量对组指定为 Name1=Value1,...,NameN=ValueN,其中 Name 是参量名称,Value 是对应的值。名称-值参量必须出现在其他参量之后,但对各个参量对组的顺序没有要求。
示例: s = uistyle(BackgroundColor="blue")
如果使用的是 R2021a 之前的版本,请使用逗号分隔每个名称和值,并用引号将 Name 引起来。
示例: s = uistyle("BackgroundColor","blue")
背景颜色,指定为 RGB 三元组、十六进制颜色代码或下表中列出的颜色选项之一。
RGB 三元组和十六进制颜色代码对于指定自定义颜色非常有用。
RGB 三元组是包含三个元素的行向量,其元素分别指定颜色中红、绿、蓝分量的强度。强度值必须位于
[0,1]范围内,例如[0.4 0.6 0.7]。十六进制颜色代码是字符向量或字符串标量,以井号 (
#) 开头,后跟三个或六个十六进制数字,范围可以是0到F。这些值不区分大小写。因此,颜色代码"#FF8800"与"#ff8800"、"#F80"与"#f80"是等效的。
此外,还可以按名称指定一些常见的颜色。下表列出了命名颜色选项、等效 RGB 三元组和十六进制颜色代码。
| 颜色名称 | 短名称 | RGB 三元组 | 十六进制颜色代码 | 外观 |
|---|---|---|---|---|
"red" | "r" | [1 0 0] | "#FF0000" |
|
"green" | "g" | [0 1 0] | "#00FF00" |
|
"blue" | "b" | [0 0 1] | "#0000FF" |
|
"cyan" | "c" | [0 1 1] | "#00FFFF" |
|
"magenta" | "m" | [1 0 1] | "#FF00FF" |
|
"yellow" | "y" | [1 1 0] | "#FFFF00" |
|
"black" | "k" | [0 0 0] | "#000000" |
|
"white" | "w" | [1 1 1] | "#FFFFFF" |
|


下表列出了浅色和深色主题中绘图的默认调色板。
| 调色板 | 调色板颜色 |
|---|---|
在 R2025a 之前的版本中: 大多数绘图默认使用这些颜色。 |
|
|
|


您可以使用 orderedcolors 和 rgb2hex 函数获取这些调色板的 RGB 三元组和十六进制颜色代码。例如,获取 "gem" 调色板的 RGB 三元组并将其转换为十六进制颜色代码。
RGB = orderedcolors("gem");
H = rgb2hex(RGB);
在 R2023b 之前的版本中: 使用 RGB = get(groot,"FactoryAxesColorOrder") 获取 RGB 三元组。
在 R2024a 之前的版本中: 使用 H = compose("#%02X%02X%02X",round(RGB*255)) 获取十六进制颜色代码。
字体颜色,指定为 RGB 三元组、十六进制颜色代码或下表中列出的选项之一。
RGB 三元组和十六进制颜色代码对于指定自定义颜色非常有用。
RGB 三元组是包含三个元素的行向量,其元素分别指定颜色中红、绿、蓝分量的强度。强度值必须位于
[0,1]范围内,例如[0.4 0.6 0.7]。十六进制颜色代码是字符向量或字符串标量,以井号 (
#) 开头,后跟三个或六个十六进制数字,范围可以是0到F。这些值不区分大小写。因此,颜色代码"#FF8800"与"#ff8800"、"#F80"与"#f80"是等效的。
此外,还可以按名称指定一些常见的颜色。下表列出了命名颜色选项、等效 RGB 三元组和十六进制颜色代码。
| 颜色名称 | 短名称 | RGB 三元组 | 十六进制颜色代码 | 外观 |
|---|---|---|---|---|
"red" | "r" | [1 0 0] | "#FF0000" |
|
"green" | "g" | [0 1 0] | "#00FF00" |
|
"blue" | "b" | [0 0 1] | "#0000FF" |
|
"cyan" | "c" | [0 1 1] | "#00FFFF" |
|
"magenta" | "m" | [1 0 1] | "#FF00FF" |
|
"yellow" | "y" | [1 1 0] | "#FFFF00" |
|
"black" | "k" | [0 0 0] | "#000000" |
|
"white" | "w" | [1 1 1] | "#FFFFFF" |
|
下表列出了浅色和深色主题中绘图的默认调色板。
| 调色板 | 调色板颜色 |
|---|---|
在 R2025a 之前的版本中: 大多数绘图默认使用这些颜色。 |
|
|
|
您可以使用 orderedcolors 和 rgb2hex 函数获取这些调色板的 RGB 三元组和十六进制颜色代码。例如,获取 "gem" 调色板的 RGB 三元组并将其转换为十六进制颜色代码。
RGB = orderedcolors("gem");
H = rgb2hex(RGB);
在 R2023b 之前的版本中: 使用 RGB = get(groot,"FactoryAxesColorOrder") 获取 RGB 三元组。
在 R2024a 之前的版本中: 使用 H = compose("#%02X%02X%02X",round(RGB*255)) 获取十六进制颜色代码。
字体粗细,指定为下列值之一:
'normal'- 特定字体定义的默认粗细'bold'- 字符轮廓比'normal'粗
并非所有字体都有加粗字体。对于非加粗字体,指定 'bold' 会得到普通字体。
字体角度,指定为 'normal' 或 'italic'。并非所有字体都有倾斜字体角度。对于无斜体字体,指定 'italic' 后会使用常规字体角度。
字体名称,指定为系统支持的一种字体名称。默认字体取决于具体操作系统和区域设置。
如果指定的字体不可用,MATLAB 将使用运行 App 的系统上的可用字体中的最佳匹配项。
表单元格文本的水平对齐方式,指定为下表中的值之一。
| 值 | 示例 |
|---|---|
'left' |
|
'right' |
|
'center' |
|
如果您将指定水平对齐的 Style 对象添加到表 UI 组件,它将优先于您为 Table 对象上的 ColumnFormat 属性指定的单元格格式值相关联的对齐方式。ColumnFormat 属性仍然像通常一样转换值。
注意
如果向树 UI 组件添加用于指定水平对齐的 Style 对象,HorizontalAlignment 值对组件外观不起作用。
裁剪长文本的一侧,指定为下表中的值之一。
| 值 | 示例 |
|---|---|
'left' |
|
'right' |
|
注意
如果将指定水平裁剪的 Style 对象添加到树的节点子集或者列表框或下拉 UI 组件的项目子集,则 HorizontalClipping 值对组件外观不起作用。您仍可以将样式添加到整个树、列表框或下拉 UI 组件。
图标,指定为预定义图标或自定义图标。
预定义图标
下表列出了用于指定预定义图标的值。
| 值 | 图标 |
|---|---|
'question' |
|
'info' |
|
'success' |
|
'warning' |
|
'error' |
|
'none' | 不显示任何图标。 |


自定义图标
可将自定义图标指定为下列值之一:
字符向量或字符串标量,指定 MATLAB 路径中的 SVG、JPEG、GIF 或 PNG 图像的文件名。也可以指定图像文件的完整路径。
m×n×3 真彩色图像数组或m×n灰度图像数组。有关详细信息,请参阅 在 MATLAB 中使用图像类型。
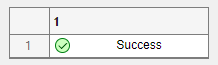
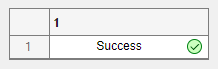
表单元格图标的对齐方式,指定为下表中的值之一。表中的示例显示为 HorizontalAlignment 样式为 'center' 的表 UI 组件指定每个 IconAlignment 值的结果。
| 值 | 描述 | 示例 |
|---|---|---|
'left' | 图标直接显示在文本的左侧。 |
|
'right' | 图标直接显示在文本的右侧。 |
|
'center' | 图标显示在单元格的中心,位于文本的后面。 |
|
'leftmargin' | 无论文本位置如何,图标都显示在单元格的最左侧。 当 |
|
'rightmargin' | 无论文本位置如何,图标都显示在单元格的最右侧。 当 |
|
注意
如果向树 UI 组件添加用于指定图标对齐的 Style 对象,IconAlignment 值对树的外观不起作用。
文本解释器,指定为:
'none'- 显示字面字符。'tex'- 使用 TeX 标记的子集解释文本。'latex'- 使用 LaTeX 标记子集解释文本。'html'- 使用 HTML 标记子集解释文本。
TeX 标记
使用 TeX 标记添加上标和下标,并在文本中包含特殊字符。
修饰符会一直作用到文本结尾,但上标和下标除外,因为它们仅修饰下一个字符或花括号中的字符。当您将解释器设置为 "tex" 时,支持的修饰符如下所示。
| 修饰符 | 描述 | 示例 |
|---|---|---|
^{ } | 上标 | "text^{superscript}" |
_{ } | 下标 | "text_{subscript}" |
\bf | 粗体 | "\bf text" |
\it | 斜体 | "\it text" |
\sl | 伪斜体(通常与斜体相同) | "\sl text" |
\rm | 常规字体 | "\rm text" |
\fontname{ | 字体名称 - 将 | "\fontname{Courier} text" |
\fontsize{ | 字体大小 - 将 | "\fontsize{15} text" |
\color{ | 字体颜色 - 将 red、green、yellow、magenta、blue、black、white、gray、darkGreen、orange 或 lightBlue。 | "\color{magenta} text" |
\color[rgb]{specifier} | 自定义字体颜色 - 将 | "\color[rgb]{0,0.5,0.5} text" |
下表列出了 "tex" 解释器所支持的特殊字符序列。某些符号看起来与它们在 MATLAB 中的样子略有不同。
| 字符序列 | 符号 | 字符序列 | 符号 | 字符序列 | 符号 |
|---|---|---|---|---|---|
| α |
| υ |
| ~ |
| ∠ |
| ϕ |
| ≤ |
|
|
| χ |
| ∞ |
| β |
| ψ |
| ♣ |
| γ |
| ω |
| ♦ |
| δ |
| Γ |
| ♥ |
| ϵ |
| Δ |
| ♠ |
| ζ |
| Θ |
| ↔ |
| η |
| Λ |
| ← |
| θ |
| Ξ |
| ⇐ |
| ϑ |
| Π |
| ↑ |
| ι |
| Σ |
| → |
| κ |
| ϒ |
| ⇒ |
| λ |
| Φ |
| ↓ |
| µ |
| Ψ |
| º |
| ν |
| Ω |
| ± |
| ξ |
| ∀ |
| ≥ |
| π |
| ∃ |
| ∝ |
| ρ |
| ∍ |
| ∂ |
| σ |
| ≅ |
| • |
| ς |
| ≈ |
| ÷ |
| τ |
| ℜ |
| ≠ |
| ≡ |
| ⊕ |
| ℵ |
| ℑ |
| ∪ |
| ℘ |
| ⊗ |
| ⊆ |
| ∅ |
| ∩ |
| ∈ |
| ⊇ |
| ⊃ |
| ⌈ |
| ⊂ |
| ∫ |
| · |
| ο |
| ⌋ |
| ¬ |
| ∇ |
| ⌊ |
| x |
| ... |
| ⊥ |
| √ |
| ´ |
| ∧ |
| ϖ |
| ∅ |
| ⌉ |
| 〉 |
| | |
| ∨ |
| 〈 |
| © |
LaTeX 标记
要使用 LaTeX 标记,请将解释器设置为 'latex'。使用 LaTeX 标记来格式化和显示数学表达式、方程和特殊字符。使用美元符号将标记的文本括起来。例如,对于行内模式,使用 '$\int_1^{20} x^2 dx$',对于显示模式,使用 '$$\int_1^{20} x^2 dx$$'。
显示的文本将使用默认的 LaTeX 字体样式。FontName、FontWeight 和 FontAngle 标签属性不起任何作用。要更改字体样式,请使用 LaTeX 标记。
MATLAB 支持大多数标准 LaTeX 数学模式命令。有关详细信息,请参阅支持的 LaTeX 命令。
HTML 标记
要使用 HTML 标记,请将解释器设置为 'html'。通过 HTML 设置字体样式会覆盖任何等效的 Style 字体属性。例如,以下代码将生成红色文本。
fig = uifigure;
s1 = uistyle("Interpreter","html");
s2 = uistyle("FontColor","blue");

t = uitable(fig);
t.Data = ["<p style='color: red;'>Cell 1</p>"; "<p style='color: red;'>Cell 2</p>"];
addStyle(t,s1)
addStyle(t,s2)
解释器支持部分 HTML 标记。一般情况下,解释器支持与文本相关的标记和样式。不支持的标记和样式将被忽略。
下表列出了支持的元素和元素属性。
| HTML 元素 | 属性 | 描述 |
|---|---|---|
a | style, target, href, title | 超链接 |
abbr | style, title | 缩写 |
address | style | 联系信息 |
article | style | 自包含的独立内容 |
aside | style | 与主要内容间接相关的内容 |
b | style | 粗体文本 |
bdi | style, dir | 格式与周围文本方向不同的内容 |
bdo | style, dir | 格式与周围文本方向不同的内容 |
big | style | 比周围文本大一个字体大小级别的文本(在 HTML5 中已弃用) |
blockquote | style, cite | 扩展引用 |
br | 不适用 | 换行符 |
caption | style | 表标题 |
center | style | 水平居中的内容 |
cite | style | 创造性工作的标题 |
code | style | 代码片段 |
col | style, align, valign, span, width | 表中的列 |
colgroup | style, align, valign, span, width | 表中的一组列 |
dd | style | 描述列表中的项或值 |
del | style, datetime | 从文档中删除的文本 |
details | style, open | 文本仅在切换到 'open' 状态时才可见的交互式小组件 |
dl | style | 描述列表 |
dt | style | 描述列表中的项或值 |
em | style | 强调的文本(通常以粗体显示) |
font | style, color, size, face | 具有指定字体属性的文本(在 HTML5 中弃用) |
footer | style | 页脚 |
h1. h2, h3, h4, h5, h6 | style | 节标题 - <h1> 是最高级别的标题,<h6> 是最低级别的标题 |
header | style | 介绍性内容 |
hr | style | 主题换行 |
i | style | 偏离周围内容的文本 - 默认以粗体方式呈现 |
ins | style, datetime | 插入文档中的文本 |
li | style | 列表中的项 |
mark | style | 标记或突出显示的文本 |
ol | style | 有序列表 |
p | style | 段落 |
pre | style | 预设格式的文本 |
s | style | 带删除线的文本 |
strike | style | 带删除线的文本(在 HTML5 中弃用) |
section | style | 独立节 |
small | style | 比周围文本小一个字体大小级别的文本(在 HTML5 中弃用) |
sub | style | 下标 |
sup | style | 上标 |
strong | style | 非常重要的文本 |
table | style, width, border, align, valign | 表 |
tbody | style, align, valign | 表正文 |
td | style, width, rowspan, colspan, align, valign | 表数据单元格 |
tfoot | style, align, valign | 汇总表列的表行组 |
th | style, width, rowspan, colspan, align, valign | 表数据单元格,指定为一组单元格的标题 |
thead | style, align, valign | 指定列标题的表行组 |
tr | style, rowspan, align, valign | 表单元格行 |
tt | style | 等宽文本(在 HTML5 中弃用) |
u | style | 具有模糊注解的文本 - 默认带下划线显示 |
ul | style | 无序列表 |
有关这些元素的详细信息,请参阅 https://developer.mozilla.org/en-US/docs/Web/HTML/Element。
要使用 HTML 标记创建运行 MATLAB 代码的超链接,请参阅创建运行函数的超链接。
您可以使用 HTML 样式属性来格式化 HTML 内容。样式属性是一串 CSS 属性及其值。
支持下列 CSS 属性:
background-colorborder-bottomborder-bottom-colorborder-bottom-left-radiusborder-bottom-right-radiusborder-bottom-styleborder-bottom-widthborder-leftborder-left-colorborder-left-styleborder-left-widthborder-radiusborder-rightborder-right-colorborder-right-styleborder-right-widthborder-spacingborder-styleborder-topborder-top-colorborder-top-left-radiusborder-top-right-radiusborder-top-styleborder-top-widthborder-widthcolordirectionfont-familyfont-sizefont-stylefont-weightheighthiddenline-heightmarginmargin-bottommargin-leftmargin-rightmargin-topmax-heightmax-widthmin-heightmin-widthoverflowoverflow-wrapoverflow-xoverflow-ypaddingpadding-bottompadding-leftpadding-rightpadding-toptext-aligntext-anchortext-decorationtext-indenttext-overflowtext-shadowtext-transformtitletranslatewhite-spacewidth
有关这些属性的详细信息,请参阅 https://developer.mozilla.org/en-US/docs/Web/CSS/Reference。
算法
添加到 UI 组件的 Style 对象在视觉效果上优先于您为组件对象设置的属性,无论您创建它们的顺序如何。例如,在以下代码中,表中显示蓝色字体颜色,即使最后对 Table 对象设置红色前景颜色。
uit = uitable(uifigure,'Data',rand(100,10));

s = uistyle;
s.FontColor = 'blue';
addStyle(uit,s);

uit.ForegroundColor = 'red';