Main Content

skyplot

Plot satellite azimuth and elevation data

Since R2021a

Description

skyplot(azdata,eldata) creates a sky plot using the azimuth and elevation data specified as matrices in degrees. Azimuth angles are measured in degrees, clockwise-positive from the North direction. Elevation angles are measured from the horizon line with 90 degrees being directly up. For details about the sky plot figure elements, see Main Sky Plot Elements.

example

skyplot(azdata,eldata,labeldata) specifies data labels as a string array with elements corresponding to each data point in the azdata and eldata inputs.

skyplot(status) specifies the azimuth and elevation data in a structure with fields SatelliteAzimuth and SatelliteElevation.

skyplot(___,Name,Value) specifies options using one or more name-value arguments in addition to the input arguments in previous syntaxes. The name-value arguments are properties of the SkyPlotChart object. For a list of properties, see SkyPlotChart Properties.

example

skyplot(parent,___) creates the sky plot in the figure, panel, or tab specified by parent.

h = skyplot(___) returns the sky plot as a SkyPlotChart object, h. Use h to modify the properties of the chart after creating it. For a list of properties, see SkyPlotChart Properties.
Examples

collapse all

Create a GNSS sensor model as a gnssSensor System object™.

gnss = gnssSensor; 

Specify the position and velocity of the sensor. Simulate the sensor readings and get status from visible satellites. Store the azimuth and elevation angles as vectors.

pos = [0 0 0]; 
vel = [0 0 0]; 
[~, ~, status] = gnss(pos, vel); 
satAz = status.SatelliteAzimuth; 
satEl = status.SatelliteElevation; 

Create random local elevation masks, with a maximum elevation of 30 degrees, to act as the local environment.

rng(8)
terrainMaskElevations = 30*rand(1,12); % elevations (degrees)
terrainMaskEdges = [0 24 48 100 132 180 204 240 276 288 300 312 360]; % azimuth edges (degrees)

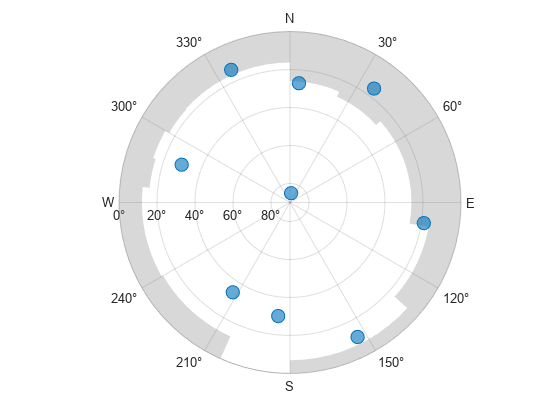
Plot the satellite positions with the elevation masks.

skyplot(satAz,satEl,MaskElevation=terrainMaskElevations,MaskAzimuthEdges=terrainMaskEdges); 

Figure contains an object of type skyplot.

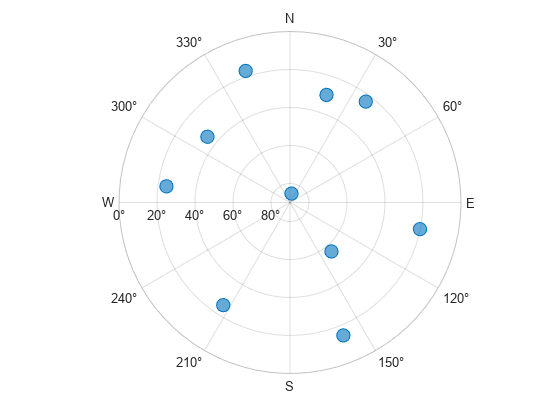
Animate the trajectory of satellite positions over time from a GNSS sensor.

Initialize the sky plot figure. Specify the relevant time-stepping information.

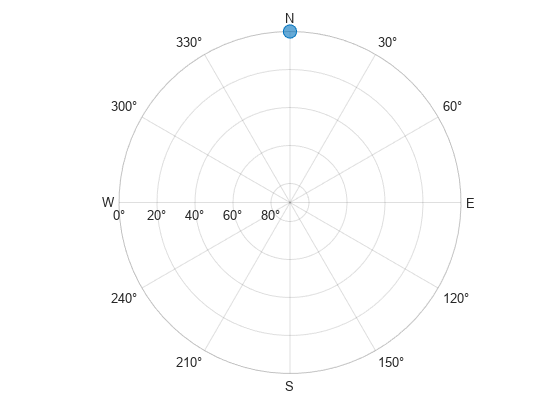
skyplotHandle = skyplot(0,0); 

Figure contains an object of type skyplot.

numHours = 12; 
dt = 100; 
numSeconds = numHours * 60 * 60; 
numSimSteps = numSeconds/dt;

Create a GNSS sensor model as a gnssSensor System Object™.

gnss = gnssSensor('SampleRate', 1/dt); 

Iterate through the time steps and do the following:

  • Simulate the sensor readings. Specify the zero position and velocity for the stationary sensor.

  • Store the azimuth and elevation angles as vectors.

  • Set the AzimuthData and ElevationData properties of the SkyPlotChart handle directly.

for i = 1:numSimSteps 

    [~, ~, status] = gnss([0 0 0],[0 0 0]); 

    satAz = status.SatelliteAzimuth; 
    satEl = status.SatelliteElevation; 

    set(skyplotHandle,'AzimuthData',satAz,'ElevationData',satEl);
    
    drawnow 
end 

Figure contains an object of type skyplot.

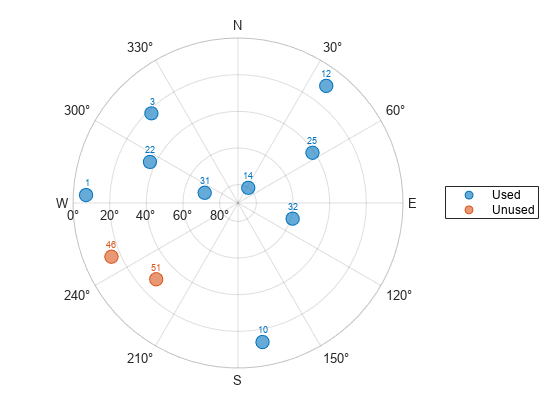
Load the azimuth and elevation data from a logfile generated by an Adafruit® GPS satellite sensor. The data provided in this example contains the azimuth and elevation of each satellite and the pseudorandom noise (PRN) codes. Store these values as vectors.

load('gpsHWInfo','hwInfo') 
satAz = hwInfo.SatelliteAzimuths; 
satEl = hwInfo.SatelliteElevations; 
prn = hwInfo.SatellitePRNs; 

Separate the satellites based on the PRN codes. To correlate each position with a group, create a categorical array. For this set of satellites, only the ones with PRNs less than 32 are used in the positioning solution.

isUnused = (prn > 32);
group = categorical(isUnused,[false true],["Used in Positioning Solution" "Unused"]);

Visualize the satellites and specify the categorical groups in the GroupData name-value argument. Specify the PRN as the label for each point. Show the legend.

skyplot(satAz,satEl,prn,GroupData=group) 
legend('Used','Unused')

Figure contains an object of type skyplot.

Specify the receiver position, RINEX navigation file, mask angle, time step size, and number of hours of data to sample from the RINEX file.

recPos = [42 -71 50];
navfile = "GODS00USA_R_20211750000_01D_GN.rnx";
maskAngle = 25;
dt = 60; % seconds
numHours = 4;

Read the navigation file, and get the GPS data of all satellites captured in the file.

data = rinexread(navfile);
[~,satIdx] = unique(data.GPS.SatelliteID);
navmsg = data.GPS(satIdx,:);

Set the starting time to the initial time of the navigation message. Then, create the time vector t.

startTime = navmsg.Time(1);
secondsPerHour = 3600;
timeElapsed = 0:dt:(secondsPerHour*numHours);
t = startTime + seconds(timeElapsed);

Initialize vectors for azimuth and elevation. Then, collect azimuth and elevation data at times t for all satellites.

numSats = numel(navmsg.SatelliteID);
allAz = NaN(numel(t),numSats);
allEl = allAz;
for idx = 1:numel(t)
    [satPos,~,satID] = gnssconstellation(t(idx),RINEXData=navmsg);
    [az,el,vis] = lookangles(recPos,satPos,maskAngle);
    allAz(idx,:) = az;
    allEl(idx,:) = el;
end

Mark all satellites below the horizon with an elevation less than 0 as missing.

allEl(allEl < 0) = missing;

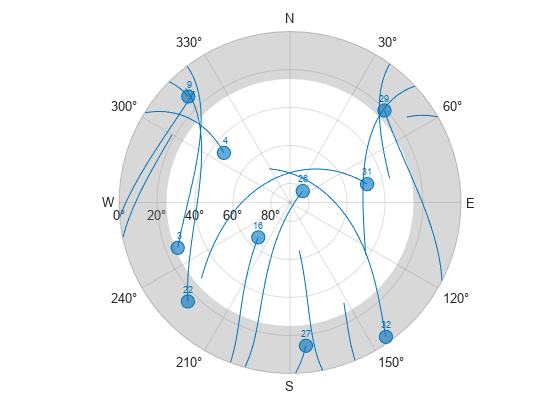
Display the satellite trajectories as an animation by creating a skyplot and updating the AzimuthData and ElevationData properties.

figure
sp = skyplot(allAz(1,:),allEl(1,:),satID,MaskElevation=maskAngle);
for idx = 1:size(allAz, 1)
    set(sp,AzimuthData=allAz(1:idx,:),ElevationData=allEl(1:idx,:));
    drawnow limitrate
end

Figure contains an object of type skyplot.

Input Arguments

collapse all

Azimuth angles for visible satellite positions, specified as an n-element vector of angles or t-by-n matrix of angles. n is the number of visible satellite positions in the plot, and t is the number of time steps of the satellites. Azimuth angles are measured in degrees, clockwise-positive from the north direction.

Example: [25 45 182 356] specifies the azimuth angles for four satellites at one time step.

s

Data Types: double

Elevation angles for visible satellite positions, specified as an n-element vector of angles or t-by-n matrix of angles. n is the number of visible satellite positions in the plot, and t is the number of time steps of the satellites. Elevation angles are measured from the horizon line with 90 degrees being directly up.

Example: [45 90 27 74] specifies the elevation angles for four satellites at one time step.

Data Types: double

Labels for visible satellite positions, specified as an n-element string array. n is the number of visible satellite positions in the plot.

Example: ["G1" "G11" "G7" "G3"]

Data Types: string

Satellite status, specified as a structure or structure array. Satellite status structures contain the fields SatelliteAzimuth and SatelliteElevation. Typically, this status structure comes from a gnssSensor object, which simulates satellite positions and velocities.

Example: gnss = gnssSensor; [~,~,status] = gnss(position,velocity)

Data Types: struct

Parent container, specified as a Figure, Panel, Tab, TiledChartLayout, or GridLayout object.

Output Arguments

collapse all

Sky plot chart, returned as a SkyPlotChart object, which is a standalone visualization. Use h to set properties on the sky plot chart. For more information, see SkyPlotChart Properties.

More About

collapse all

Main Sky Plot Elements

Figure showing a circular plot for satellite positions based on azimuth and elevation angles. Zero degrees for Azimuth is directly North with positive values going clockwise. Elevation angles are shown with circular axes with the outer-circle being the horizon line or zero degrees. 90 degrees elevation is directly up or the center point of the circular plot. Positions are colored by group and have specified labels

The main elements of the figure are:

  • Azimuth axes — Specified by the azdata input argument, azimuth angle positions are measured clockwise-positive from the North direction.

  • Elevation axes —Specified by the eldata input argument, elevation angle positions are measured from the horizon line with 90 degrees being directly up.

  • Labels — Specified by the labeldata input argument as a string array with an element for each point in the azdata and eldata vectors.

  • Groups — Specified by the GroupData property, a categorical array defines the group for each satellite position.

Standalone Visualization

A standalone visualization is a chart designed for a special purpose that works independently from other charts. Unlike other charts such as plot and surf, a standalone visualization has a preconfigured axes object built into it, and some customizations are not available. A standalone visualization also has these characteristics:

  • It cannot be combined with other graphics elements, such as lines, patches, or surfaces. Thus, the hold command is not supported.

  • The gca function can return the chart object as the current axes.

  • You can pass the chart object to many MATLAB® functions that accept an axes object as an input argument. For example, you can pass the chart object to the title function.

Version History

Introduced in R2021a

expand all

See Also

Functions

Properties

Objects