主要内容

getMask

Get labels and time-frequency map based on time-frequency mask

Since R2026a

    Description

    lbl = getMask(msk,x) returns an array of label masks associated with the time-frequency mask msk and the time-frequency map of the input signal x.

    lbl = getMask(msk,x,PixelType=pt) also specifies the pixel format to be returned in lbl when msk.MaskFormat is "pixel".

    example

    [lbl,S] = getMask(___)also returns S, the time-frequency map of the input signal x.

    Examples

    collapse all

    Label Gaussian atoms in the time-frequency domain using a time-frequency region-of-interest (ROI) label definition and spectrogram options. Get mask from labeled signal in the time-frequency domain.

    Generate Signal and Visualize Spectrogram

    Generate a signal that consists of a voltage-controlled oscillator and five Gaussian atoms. The signal is sampled at 14 kHz for two seconds. Plot the spectrogram of the signal.

    Fs = 14000;
    t = (0:1/Fs:2)';
    st = 0.01;
    gaussFun = @(A,x,mu,f) exp(-(x-mu).^2/(2*st^2)).*sin(2*pi*f.*x)*A';
    atomTimeCenters = [0.2 0.5 1 1.3 1.8];
    atomFreqCenters = [2 6 2 5 1]*1000;
    atomAmplitudes = [1 1 1 1 1]/10;
    s = gaussFun(atomAmplitudes,t,atomTimeCenters,atomFreqCenters) ...
        + vco(chirp(t+0.1,0,t(end),3).*exp(-2*(t-1).^2),[0.1 0.4]*Fs,Fs);
    
    bt = 0.2;
    tr = 0.05;
    op = 99;
    pspectrum(s,Fs,"spectrogram", ...
        Leakage=bt,TimeResolution=tr,OverlapPercent=op)

    Figure contains an axes object. The axes object with title Fres = 64.5333 Hz, Tres = 50 ms, xlabel Time (s), ylabel Frequency (kHz) contains an object of type image.

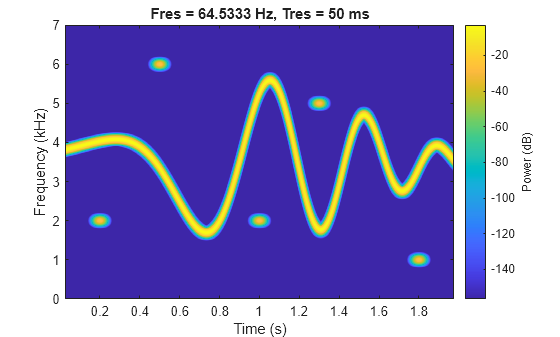
    The spectrogram shows four patches in time-frequency domain that correspond with the Gaussian atoms. Define the times and frequencies for all the atoms.

    atomTimes = atomTimeCenters'+[-st st]*5.5;
    atomFreqs = atomFreqCenters'+[-1 1]*200;

    Label Signal in Time-Frequency Domain

    Create a numeric time-frequency ROI label definition to label the Gaussian atoms. Specify spectrogram options with leakage properties.

    opts = labelSpectrogramOptions("leakage", ...
        Leakage=40*(1-bt),Overlap=op, ...
        TimeResolutionMode="specify",TimeResolution=tr);
    
    lblDef = signalLabelDefinition("Atom", ...
        LabelDataType="numeric", ...
        LabelType="roiTimeFrequency",TimeFrequencyOptions=opts);

    Create a labeled signal set from the signal and time-frequency ROI label definition.

    lss = labeledSignalSet(s,lblDef,SampleRate=Fs);

    Label the atoms in time-frequency domain. Set the label values to 1 through 5.

    setLabelValue(lss,1,"Atom",atomTimes,atomFreqs,1:5)

    Display the label table. Each label has its time-frequency ROI limits and a numeric value.

    lblTable = lss.Labels.Atom{1};
    lblTable.Value = cell2mat(lblTable.Value)
    lblTable=5×3 table
        TimeROILimits     FrequencyROILimits    Value
        ______________    __________________    _____
    
        0.145    0.255       1800    2200         1  
        0.445    0.555       5800    6200         2  
        0.945    1.055       1800    2200         3  
        1.245    1.355       4800    5200         4  
        1.745    1.855        800    1200         5  


    Get and Visualize Array of Label Masks

    Create a time-frequency mask with the label table and spectrogram options. Specify the signal sample rate and mask format.

    msk = timeFrequencyMask(lblTable,opts, ...
        SampleRate=Fs,MaskFormat="pixel",OverlapAction="prioritizeByList");

    Read the time-frequency mask and get the array of label regions as a per-pixel matrix and as a 3-D binary array.

    lblPerPixel = getMask(msk,s,PixelType="perpixel");
    lblBinaries = getMask(msk,s,PixelType="binary");

    Plot the array of labels in per-pixel format. The white rectangular patches represent time-frequency regions where a label exists.

    figure
    tiledlayout("flow")
    nexttile
    imshow(~isnan(lblPerPixel))
    title("2-D per-pixel mask (grayscale image)")

    Plot the first three pages of the array of labels in binary format. Each page consists of pixels marked with true (1) or false (0), where true (1) represents a labeled time-frequency ROI. The three-page 3-D array forms an image with colored rectangular patches that depict the labeled ROIs:

    • Red patch (first page of array of labels), represents the first time-frequency ROI, labeled as 1.

    • Green patch (second page of array of labels), represents the second time-frequency ROI, labeled as 2.

    • Blue patch (third page of array of labels), represents the third time-frequency ROI, labeled as 3.

    nexttile
    imshow(double(lblBinaries(:,:,1:3)))
    title("3-D binary mask (RGB image)")
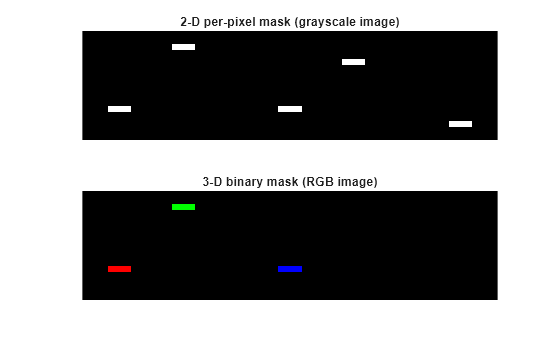
    Figure contains 2 axes objects. Hidden axes object 1 with title 2-D per-pixel mask (grayscale image) contains an object of type image. Hidden axes object 2 with title 3-D binary mask (RGB image) contains an object of type image.

    Input Arguments

    collapse all

    Time-frequency mask, specified as a timeFrequencyMask object.

    Example: msk = timeFrequencyMask(table([0.1 0.2],[160 180],true),labelSpectrogramOptions,SampleRate=1000) specifies a time-frequency mask with a true time-frequency region that spans from 0.1 to 0.2 seconds and from 160 to 180 Hz, where the time-frequency map of the signal is computed using default label spectrogram options.

    Example: msk = timeFrequencyMask(table([10 20;120 150;160 190],[0.16 0.18;0.08 0.14;0.2 0.22],categorical(["whale1";"whale2";"whale1"])), labelSpectrogramOptions("rbw")) specifies a time-frequency mask with two whale1 time-frequency regions and one whale2 time-frequency region, where the time-frequency map of the signal is computed using resolution-bandwidth (RBW) label spectrogram options. The time limits are in samples and the frequency limits are in radians/sample.

    Input signal, specified as a vector.

    Example: chirp(0:1/1e3:1,25,1,50) specifies a chirp sampled at 1 kHz.

    Data Types: single | double
    Complex Number Support: Yes

    Pixel format for array of label masks, specified as "perpixel" or "binary".

    • When you specify msk where the mask format (msk.MaskFormat) is "pixel", you can return lbl as a matrix of label values or as a 3-D array of binary values depending on the value of pt.

      • "perpixel"getMask returns lbl as a matrix and assigns a label value to each pixel. The function assigns values to overlapping according to the value of msk.MaskPriority.

      • "binary"getMask returns lbl as a 3-D array, where each page corresponds to a logical or categorical label, and each true pixel indicates a label value to that page.

    • If you specify msk where msk.MaskFormat is other than "pixel", then getMask ignores the value specified in pt.

    For example, assume three categorical labels: "b" (blue), "o" (orange), and "g" (green). When you specify lbl = getMask(msk,x,PixelType=pt), the getMask function returns lbl as a matrix or array, as shown in this image.

    Data Types: char | string

    Output Arguments

    collapse all

    Array of label masks, returned as a matrix, 3-D array, cell array, or table. The output lbl lists each time-frequency region of interest (ROI) and the corresponding label value.

    The type of output depends on the value of msk.MaskFormat:

    • If msk.MaskFormat is "pixel", then getMask returns lbl as a matrix or 3-D array with the same number of rows and columns as the time-frequency map, S. The function returns lbl as a matrix or 3-D array depending on the value of pt.

    • If msk.MaskFormat is "boundingbox", then getMask returns lbl as a 1-by-2 cell array.

      • The first element of the cell array contains the indices associated with the times and frequencies for each time-frequency region.

      • The second element of the cell array contains the label value for each time-frequency region.

    • If msk.MaskFormat is "table", then getMask returns lbl as an N-by-3 table.

      • N is the number of time-frequency regions.

      • The variables comprise the time ROI limits, frequency ROI limits, and label value.

    Time-frequency map, returned as a matrix.

    Version History

    Introduced in R2026a