timeFrequencyMask
Description
Use timeFrequencyMask to store the locations of regions of interest
(ROI) of a signal representation in time-frequency domain together with the label or category
values for each region. You can use the timeFrequencyMask object to plot
spectrograms with either overlaid ROI or categorical array representations next to the
spectrogram.
Creation
Description
msk = timeFrequencyMask(lblTable,tfOpts)msk, from the table of
time-frequency ROIs and labels, lblTable, and the object
tfOpts that stores options to compute the time-frequency map for
an input signal. A time-frequency mask defines the locations of
time-frequency ROIs of a signal representation in the time-frequency domain, together
with the label or category values for each ROI.
msk = timeFrequencyMask(src,PropertyName=Value)
Input Arguments
Properties
Object Functions
Examples
Create a signal with a duration of 1 second so that its spectrogram shows rectangular time-frequency regions. The sample rate is 1000 Hz.
Fs = 1000;
t = (0:1/Fs:1-1/Fs);
x = 3*sinc(600*(t-0.15)).*(t>0.1).*(t<0.2) + ...
    cos(2*pi*400*t).*sinc(40*(t-0.55)).*(t>0.5).*(t<0.6) + ...
    cos(2*pi*200*t).*sinc(100*(t-0.85)).*(t>0.8).*(t<0.9);
pspectrum(x,Fs,"spectrogram",Leakage=0.98, ...
    TimeResolution=0.1,OverlapPercent=0,MinThreshold=-50)
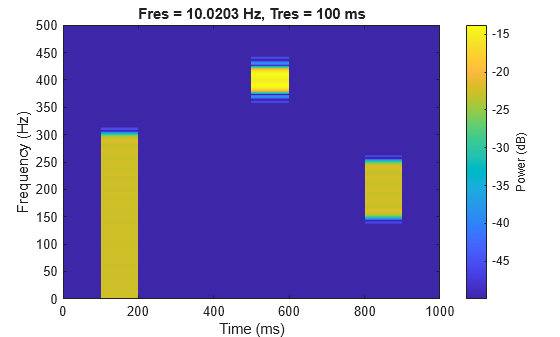
The spectrogram shows three time-frequency regions of interest (ROIs) with different time and frequency ranges. Since these regions have different frequency bandwidths, the regions can have string labels such as "narrowBand", "wideBand", and "ultraWideBand". Then, the region specifications are as follows:
"narrowBand" ROI — Time ranges within [0.5, 0.6] seconds and frequency ranges within [380, 420] Hz."wideBand"ROI — Time ranges within [0.8, 0.9] seconds and frequency ranges within [150, 250] Hz."
ultraWideBand"ROI — Time ranges within [0.1, 0.2] seconds and frequency ranges within [0, 300] Hz.
Create a table that lists all time-frequency ROIs and labels.
timeLimits = [0.5 0.6;0.8 0.9;0.1 0.2];
freqLimits = [380 420;150 250;0 300];
tfLabels = ["narrowBand" "wideBand" "ultraWideBand"]';
lblTable = table(timeLimits,freqLimits,tfLabels)
lblTable=3×3 table
    timeLimits    freqLimits       tfLabels
    __________    __________    _______________

    0.5    0.6    380    420    "narrowBand"
    0.8    0.9    150    250    "wideBand"
    0.1    0.2      0    300    "ultraWideBand"
Create a labelSpectrogramOptions object to store the options to compute the time-frequency map for an input signal.
opts = labelSpectrogramOptions("leakage", ...
    Leakage=40*(1-0.98),Overlap=0, ...
    TimeResolutionMode="specify",TimeResolution=0.1, ...
    MinimumThresholdMode="specify",MinimumThreshold=-50)
opts =
  labelSpectrogramOptions with properties:

          ResolutionType: "leakage"
                 Overlap: 0
                 Leakage: 0.8000
      TimeResolutionMode: "specify"
          TimeResolution: 0.1000
                Reassign: 0
    MinimumThresholdMode: "specify"
        MinimumThreshold: -50
             UseDecibels: 1
Create a time-frequency mask with the table of time-frequency ROIs and labels, and time-frequency options.
msk = timeFrequencyMask(lblTable,opts, ...
    MaskFormat="boundingbox",SampleRate=Fs)
msk =
  timeFrequencyMask with properties:

             FreqLocation: "yaxis"
       IncludePartialBins: 0
               MaskFormat: "boundingbox"
    MaxFrequencyBandwidth: Inf
          MaxTimeDuration: Inf
    MinFrequencyBandwidth: 0
          MinTimeDuration: 0
               SampleRate: 1000
          SpecifyMaskSize: 0
     TimeFrequencyOptions: [1×1 labelSpectrogramOptions]
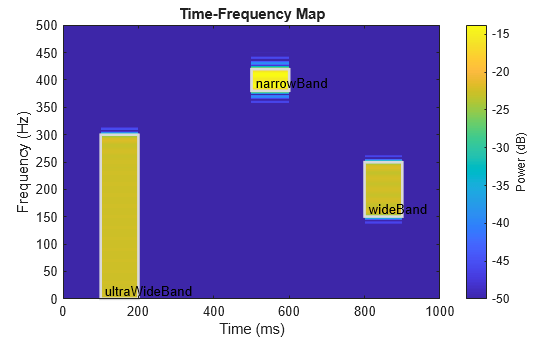
Read the time-frequency mask and display it above the time-frequency image. The plot displays the labeled time-frequency ROIs.
plotMask(msk,x)
Label Gaussian atoms in the time-frequency domain using a time-frequency region-of-interest (ROI) label definition and spectrogram options. Create, get, and plot mask from labeled signal in the time-frequency domain.
Generate Signal and Visualize Spectrogram
Generate a signal that consists of a voltage-controlled oscillator and five Gaussian atoms. The signal is sampled at 14 kHz for two seconds. Plot the spectrogram of the signal.
Fs = 14000;
t = (0:1/Fs:2)';
st = 0.01;
gaussFun = @(A,x,mu,f) exp(-(x-mu).^2/(2*st^2)).*sin(2*pi*f.*x)*A';
atomTimeCenters = [0.2 0.5 1 1.3 1.8];
atomFreqCenters = [2 6 2 5 1]*1000;
atomAmplitudes = [1 1 1 1 1]/10;
s = gaussFun(atomAmplitudes,t,atomTimeCenters,atomFreqCenters) ...
    + vco(chirp(t+0.1,0,t(end),3).*exp(-2*(t-1).^2),[0.1 0.4]*Fs,Fs);

bt = 0.2;
tr = 0.05;
op = 99;
pspectrum(s,Fs,"spectrogram", ...
    Leakage=bt,TimeResolution=tr,OverlapPercent=op)
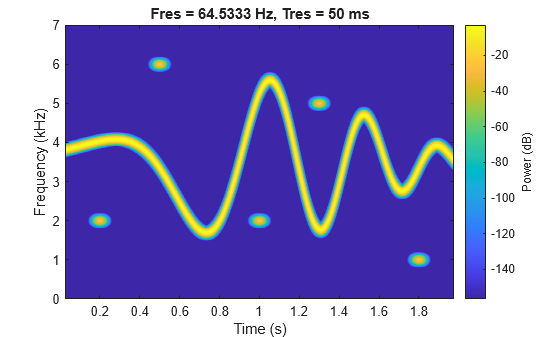
The spectrogram shows four patches in time-frequency domain that correspond with the Gaussian atoms. Define the times and frequencies for all the atoms.
atomTimes = atomTimeCenters'+[-st st]*5.5;
atomFreqs = atomFreqCenters'+[-1 1]*200;
Label Signal in Time-Frequency Domain
Create a numeric time-frequency ROI label definition to label the Gaussian atoms. Specify spectrogram options with leakage properties.
opts = labelSpectrogramOptions("leakage", ...
    Leakage=40*(1-bt),Overlap=op, ...
    TimeResolutionMode="specify",TimeResolution=tr);

lblDef = signalLabelDefinition("Atom", ...
    LabelDataType="numeric", ...
    LabelType="roiTimeFrequency",TimeFrequencyOptions=opts);
Create a labeled signal set from the signal and time-frequency ROI label definition.
lss = labeledSignalSet(s,lblDef,SampleRate=Fs);
Label the atoms in time-frequency domain. Set the label values to 1 through 5.
setLabelValue(lss,1,"Atom",atomTimes,atomFreqs,1:5)Display the label table. Each label has its time-frequency ROI limits and a logical value.
lblTable = lss.Labels.Atom{1};
lblTable.Value = cell2mat(lblTable.Value)lblTable=5×3 table
TimeROILimits FrequencyROILimits Value
______________ __________________ _____
0.145 0.255 1800 2200 1
0.445 0.555 5800 6200 2
0.945 1.055 1800 2200 3
1.245 1.355 4800 5200 4
1.745 1.855 800 1200 5
Visualize Labeled Signal in Time-Frequency Domain
Create a time-frequency mask with the label table and spectrogram options. Specify the signal sample rate and mask format.
msk = timeFrequencyMask(lblTable,opts, ...
    SampleRate=Fs,MaskFormat="pixel",OverlapAction="prioritizeByList");
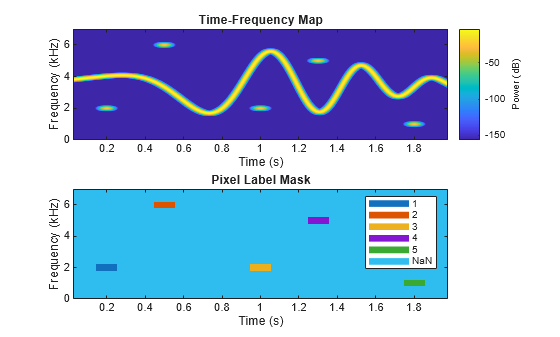
Read the time-frequency mask and display it above the time-frequency image.
plotMask(msk,s)
Get and Visualize Array of Label Masks
Read the time-frequency mask and get the array of label regions as a per-pixel matrix and as a 3-D binary array.
lblPerPixel = getMask(msk,s,PixelType="perpixel");
lblBinaries = getMask(msk,s,PixelType="binary");
Plot the array of labels in per-pixel format. The white rectangular patches represent time-frequency regions where a label exists.
figure
tiledlayout("flow")
nexttile
imshow(~isnan(lblPerPixel))
title("2-D per-pixel mask (grayscale image)")
Plot the first three pages of the array of labels in binary format. Each page consists of pixels marked with true (1) or false (0), where true (1) represents a labeled time-frequency ROI. The three-page 3-D array forms an image with colored rectangular patches that depict the labeled ROIs:
Red patch (first page of array of labels), represents the first time-frequency ROI, labeled as
1.Green patch (second page of array of labels), represents the second time-frequency ROI, labeled as
2.Blue patch (third page of array of labels), represents the third time-frequency ROI, labeled as
3.
nexttile
imshow(double(lblBinaries(:,:,1:3)))
title("3-D binary mask (RGB image)")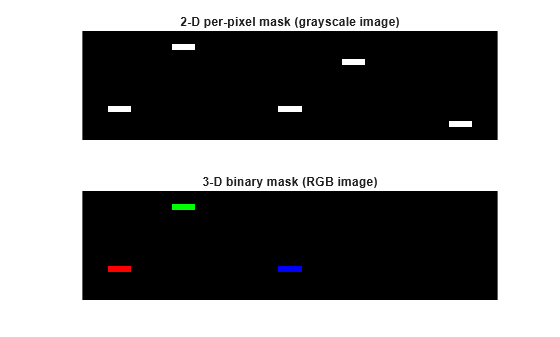
Version History
Introduced in R2026a