plotMask
Description
plotMask( plots the
time-frequency map of the input signal x along with an array of rectangular label masks,
both in the current figure, using the time-frequency mask msk,x)msk.
If
msk.MaskFormat"pixel", thenplotMaskdisplays the time-frequency map and the label array on two subplots.If
msk.MaskFormat"boundingbox", thenplotMaskdisplays the time-frequency map and the labeled time-frequency regions of interest (ROIs) on a single plot.If
msk.MaskFormat"table", thenplotMaskdisplays only the time-frequency map.The
plotMaskfunction uses thelabelSpectrogramOptionsobject stored inmsk.TimeFrequencyOptions
Examples
Label Gaussian atoms in the time-frequency domain using a time-frequency region-of-interest (ROI) label definition and spectrogram options. Plot mask from labeled signal in the time-frequency domain.
Generate Signal and Visualize Spectrogram
Generate a signal that consists of a voltage-controlled oscillator and five Gaussian atoms. The signal is sampled at 14 kHz for two seconds. Plot the spectrogram of the signal.
Fs = 14000;
t = (0:1/Fs:2)';
st = 0.01;
gaussFun = @(A,x,mu,f) exp(-(x-mu).^2/(2*st^2)).*sin(2*pi*f.*x)*A';
atomTimeCenters = [0.2 0.5 1 1.3 1.8];
atomFreqCenters = [2 6 2 5 1]*1000;
atomAmplitudes = [1 1 1 1 1]/10;
s = gaussFun(atomAmplitudes,t,atomTimeCenters,atomFreqCenters) ...
    + vco(chirp(t+0.1,0,t(end),3).*exp(-2*(t-1).^2),[0.1 0.4]*Fs,Fs);

bt = 0.2;
tr = 0.05;
op = 99;
pspectrum(s,Fs,"spectrogram", ...
    Leakage=bt,TimeResolution=tr,OverlapPercent=op)
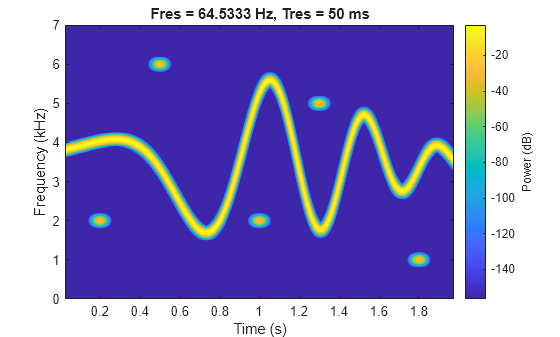
The spectrogram shows four patches in time-frequency domain that correspond with the Gaussian atoms. Define the times and frequencies for all the atoms.
atomTimes = atomTimeCenters'+[-st st]*5.5;
atomFreqs = atomFreqCenters'+[-1 1]*200;
Label Signal in Time-Frequency Domain
Create a logical time-frequency ROI label definition to label the Gaussian atoms. Specify spectrogram options with leakage properties.
opts = labelSpectrogramOptions("leakage", ...
    Leakage=40*(1-bt),Overlap=op, ...
    TimeResolutionMode="specify",TimeResolution=tr);

lblDef = signalLabelDefinition("Atom", ...
    LabelDataType="logical", ...
    LabelType="roiTimeFrequency",TimeFrequencyOptions=opts);
Create a labeled signal set from the signal and time-frequency ROI label definition.
lss = labeledSignalSet(s,lblDef,SampleRate=Fs);
Label the atoms in time-frequency domain. Set the label values to true.
setLabelValue(lss,1,"Atom",atomTimes,atomFreqs,true(5,1))Display the label table. Each label has its time-frequency ROI limits and a logical value.
lblTable = lss.Labels.Atom{1};
lblTable.Value = cell2mat(lblTable.Value)lblTable=5×3 table
TimeROILimits FrequencyROILimits Value
______________ __________________ _____
0.145 0.255 1800 2200 true
0.445 0.555 5800 6200 true
0.945 1.055 1800 2200 true
1.245 1.355 4800 5200 true
1.745 1.855 800 1200 true
Visualize Labeled Signal in Time-Frequency Domain
Create a time-frequency mask with the label table and spectrogram options. Specify the signal sample rate and mask format.
msk = timeFrequencyMask(lblTable,opts, ...
    SampleRate=Fs,MaskFormat="boundingbox")
msk =
  timeFrequencyMask with properties:

             FreqLocation: "yaxis"
       IncludePartialBins: 0
               MaskFormat: "boundingbox"
    MaxFrequencyBandwidth: Inf
          MaxTimeDuration: Inf
    MinFrequencyBandwidth: 0
          MinTimeDuration: 0
               SampleRate: 14000
          SpecifyMaskSize: 0
     TimeFrequencyOptions: [1×1 labelSpectrogramOptions]
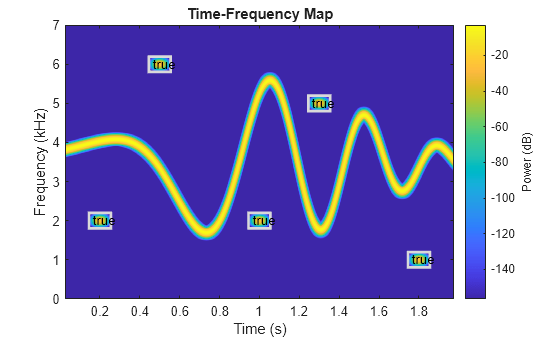
Read the time-frequency mask and display it above the time-frequency image.
plotMask(msk,s)
Input Arguments
Version History
Introduced in R2026a