Stateflow.Data
Data in chart, state, box, or function
Description
Use Stateflow.Data objects to store values that are visible at a
specific level of the Stateflow® hierarchy. For more information, see Add Stateflow Data and
Set Data Properties.
Creation
Description
Input Arguments
Parent for the new data object, specified as a Stateflow API object of one of these types:
Properties
Stateflow API objects have properties that correspond to the values you set in the Stateflow
Editor. To access or modify a property, use dot notation. To access or modify multiple
properties for multiple API objects, use the get and
set functions, respectively. For more information, see Modify Properties and Call Functions of Stateflow Objects.
Interface
Name of the data object, specified as a string scalar or character vector.
Scope of the data object, specified as one of these values:
"Local""Input""Output""Constant""Parameter""Data Store Memory""Temporary""Imported""Exported"
For more information, see Scope.
Port index for the data object, specified as an integer scalar. This property applies only to input and output data. For more information, see Port.
Method for updating data object, specified as "Discrete" or
"Continuous". This property applies only when the
ChartUpdate property of the chart that contains the data is
"CONTINUOUS". For more information, see Continuous-Time Modeling in Stateflow.
Method for initializing the value of the data object, specified as a string scalar or character vector that depends on the scope of the data:
For local and output data, use
"Expression"or"Parameter".For constant data, use
"Expression".For input data, parameters, and data store memory, use
"Not
                      Needed"
.
To specify the initial value of the data object, use the
Props.InitialValue property.
For more information, see Initialize method.
Whether to save the value of the data object to a variable of the same name in the
MATLAB® base workspace at the end of the simulation, specified as a numeric or
logical 1 (true) or 0 (false). This property
applies only to data in charts that use C as the action language. For more
information, see Save final value to base workspace.
Whether the data object is a tunable parameter, specified as a numeric or logical
1 (true) or 0 (false). Only tunable parameters
can be modified during simulation. This property applies only to parameter
data.
Data Specification
Type of the data object, specified as a string scalar or character vector that
depends on the Props.Type.Method property of the data object:
If the
Props.Type.Methodproperty of the data object is"Inherit", the value of this property is"Inherit: From definition in chart"for local data and"Inherit: Same as Simulink"for input, output, and parameter data.If the
Props.Type.Methodproperty of the data object is"Built-in", you can specify this property with one of these options:"double""single""int8""int16""int32""int64""uint8""uint16""uint32""uint64""boolean""string""ml"(Supported only in charts that use C as the action language)
Otherwise, the
Props.Typeproperties of the data object determine the value of this property.
For more information, see the section Add Data in Create Charts by Using the Stateflow API.
Data specification properties, specified as a Stateflow.DataProps object with these properties:
Type.Method— Method for setting the type of the data object, specified as a string scalar or character vector.For local, input, output, or parameter data, use
"Inherited","Built-in","Bus Object","Enumerated","Expression", or"Fixed point".For constant data, use
"Built-in","Expression", or"Fixed point".For data store memory data, use
"Inherited".
This property is equivalent to the Mode field of the Data Type Assistant in the Model Explorer and the Data properties dialog box. For more information, see Specify Scope and Type of Stateflow Data.
Type.BusObject— Name of theSimulink.Busobject that defines the data object, specified as a string scalar or character vector. This property applies only when theType.Methodproperty of the data object is"Bus Object". For more information, see Access Bus Signals.Type.EnumType— Name of the enumerated type that defines the data object, specified as a string scalar or character vector. This property applies only when theType.Methodproperty of the data object is"Enumerated". For more information, see Reference Values by Name by Using Enumerated Data.Type.Expression— Expression that evaluates to the data type of the data object, specified as a string scalar or character vector. This property applies only when theType.Methodproperty of the data object is"Expression". For more information, see Specify Data Properties by Using MATLAB Expressions.Type.Signed— Signedness, specified as a numeric or logical 1 (true) or 0 (false). This property applies only when theType.Methodproperty of the data object is"Fixed point". For more information, see Fixed-Point Data in Stateflow Charts.Type.WordLength— Word length, in bits, specified as a string scalar or character vector. This property applies only when theType.Methodproperty of the data object is"Fixed point". For more information, see Fixed-Point Data in Stateflow Charts.Type.Fixpt.ScalingMode— Method for scaling the fixed-point data object, specified as"Binary point","Slope and bias", or"None". This property applies only when theType.Methodproperty of the data object is"Fixed point". For more information, see Fixed-Point Data in Stateflow Charts.Type.Fixpt.FractionLength— Fraction length, in bits, specified as a string scalar or character vector. This property applies only when theType.Methodproperty is"Fixed point"and theType.Fixpt.ScalingModeproperty is"Binary point".Type.Fixpt.Slope— Slope, specified as a string scalar or character vector. This property applies only when theType.Methodproperty is"Fixed point"and theType.Fixpt.ScalingModeproperty is"Slope and bias".Type.Fixpt.Bias— Bias, specified as a string scalar or character vector. This property applies only when theType.Methodproperty is"Fixed point"and theType.Fixpt.ScalingModeproperty is"Slope and bias".Type.Fixpt.Lock— Whether to prevent replacement of the fixed-point type with an autoscaled type chosen by the Fixed-Point Tool (Fixed-Point Designer), specified as a numeric or logical 1 (true) or 0 (false). This property applies only when theType.Methodproperty of the data object is"Fixed point".Array.Size— Size of the data object, specified as a string scalar or character vector. For more information, see Specify Size of Stateflow Data.Array.IsDynamic— Whether the data object has variable size, specified as a numeric or logical 1 (true) or 0 (false). This property is equivalent to the Variable Size check box in the Property Inspector, the Model Explorer, or the Data properties dialog box. For more information, see Declare Variable-Size Data in Stateflow Charts.Array.FirstIndex— Index for the first element of the array data object, specified as a string scalar or character vector. This property applies only to array data in charts that use C as the action language. For more information, see Save final value to base workspace.Complexity— Whether the data object accepts complex values, specified as"On"or"Off". For more information, see Complex Data in Stateflow Charts.InitialValue— Initial value, specified as a string scalar or character vector. For more information, see Initial value.Range.Minimum— Minimum value, specified as a string scalar or character vector. For more information, see Limit range.Range.Maximum— Maximum value, specified as a string scalar or character vector. For more information, see Limit range.ResolveToSignalObject— Whether the data object resolves to aSimulink.Signalobject that you define in the model or base workspace, specified as a numeric or logical 1 (true) or 0 (false). For more information, see Resolve Data Properties from Simulink Signal Objects.Unit.Name— Unit of measurement, specified as a string scalar or character vector. This property applies only to input and output data. For more information, see Specify Units for Stateflow Data.
This property is read-only.
Data size as determined by the compiler, specified as a character vector.
This property is read-only.
Data type as determined by the compiler, specified as a character vector.
Active State Output
This property is read-only.
State or chart monitored by the data object, specified as an empty array or a
Stateflow.AtomicSubchart, Stateflow.Chart,
Stateflow.SimulinkBasedState, Stateflow.State, or
Stateflow.StateTransitionTableChart object. For more information,
see Monitor State Activity Through Active State Data.
Signal Logging and Test Point Monitoring
Signal logging properties for the data object, specified as a Stateflow.SigLoggingInfo object
with these properties:
DataLogging— Whether to enable signal logging, specified as a numeric or logical 1 (true) or 0 (false).DecimateData— Whether to limit the amount of logged data, specified as a numeric or logical 1 (true) or 0 (false).Decimation— Decimation interval, specified as an integer scalar. This property applies only when theDecimateDataproperty istrue.LimitDataPoints— Whether to limit the number of data points to log, specified as a numeric or logical 1 (true) or 0 (false).MaxPoints— Maximum number of data points to log, specified as an integer scalar. This property applies only when theLimitDataPointsproperty istrue.NameMode— Source of the signal name, specified as"SignalName"or"Custom".LoggingName— Custom signal name, specified as a string scalar or character vector. This property applies only when theNameModeproperty is"Custom".
Signal logging saves the values of the data object to the MATLAB workspace during simulation. For more information, see Log Simulation Output for States and Data.
Example: data.LoggingInfo.DataLogging = true;
Whether to set the data object as a test point, specified as a numeric or logical
1 (true) or 0 (false). You can monitor
testpoints with a floating scope during simulation. You can also log test point values
to the MATLAB workspace. For more information, see Configure Signals as Test Points (Simulink).
Debugging
Debugger properties for the data object, specified as a Stateflow.DataDebug object with this property:
Watch— Whether to track the value of the data object in the Breakpoints and Watch window, specified as a numeric or logical 1 (true) or 0 (false). For more information, see View Data in the Breakpoints and Watch Window.
Example: data.Debug.Watch = true;
Hierarchy
This property is read-only.
Machine that contains the data object, specified as a Stateflow.Machine object.
This property is read-only.
Location of the parent of the data object in the model hierarchy, specified as a character vector.
Identification
Description for the data object, specified as a string scalar or character vector.
Document link for the data object, specified as a string scalar or character vector.
User-defined tag for the data object, specified as data of any type.
This property is read-only.
Session-independent identifier, specified as an integer scalar. Use this property to distinguish the data object from other objects in its parent chart.
This property is read-only.
Unique identifier, specified as an integer scalar. Unlike
SSIdNumber, the value of this property is reassigned every time
you start a new MATLAB session and may be recycled after an object is deleted.
Object Functions
getParent | Identify parent of object |
getReferences | Identify references to symbol name |
renameReferences | Rename symbol and update references to symbol name |
dialog | Open properties dialog box |
view | Display object in editing environment |
Examples
Add a data object to the chart ch. Specify its name, scope, and
data type.
data = Stateflow.Data(ch);
data.Name = "x";
data.Scope = "Input";
data.Props.Type.Method = "Built-in";
data.DataType = "single";
Rename and update the references to the chart output y.
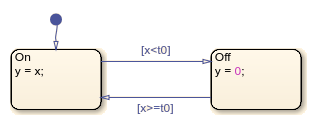
Open the model and access the Stateflow.Data object for the chart output y.
open_system("sfRectifyAPIExample")
data = find(sfroot,"-isa","Stateflow.Data",Scope="Output");
data.Name
ans =
'y'
Find the locations where the chart refers to the chart output.
references = getReferences(data)
references=2×1 SymbolReference array with properties:
    Position
    WhereUsed
Display the names and entry actions of the states that refer to the chart output.
whereUsed = [references.WhereUsed];
classes = arrayfun(@class,whereUsed,UniformOutput=false);
idx = (classes=="Stateflow.State");
states = whereUsed(idx);
get(states,{"Name" "EntryAction"})
ans = 2×2 cell
    {'On' }    {'y = x;'}
    {'Off'}    {'y = 0;'}
Change the Name property of the chart output to "z" and update the references to the output in the chart.
renameReferences(data,"z")
data.Name
ans = 'z'
Display the names and modified entry actions of the states that refer to the chart output.
get(states,{"Name" "EntryAction"})ans = 2×2 cell
{'On' } {'z = x;'}
{'Off'} {'z = 0;'}
Version History
Introduced before R2006aThe object functions getReferences and
renameReferences find and update the locations, such as state and
transition actions, where the chart refers to the name of a data object:
The object function
getReferencesreturns the locations where a chart refers to a data name.The object function
renameReferencesrenames a data object and updates all references to the data name in the chart.
The Stateflow.Data function does not support arguments of type
Stateflow.Machine. The presence of machine-parented data in a model
prevents the reuse of generated code and other code optimizations. This type of data is also
incompatible with many Simulink® and Stateflow features. To make Stateflow data accessible to other charts and blocks in a model, use data store memory.
For more information, see Access Data Store Memory from a Chart.
MATLAB Command
You clicked a link that corresponds to this MATLAB command:
Run the command by entering it in the MATLAB Command Window. Web browsers do not support MATLAB commands.
选择网站
选择网站以获取翻译的可用内容,以及查看当地活动和优惠。根据您的位置,我们建议您选择:。
您也可以从以下列表中选择网站:
如何获得最佳网站性能
选择中国网站(中文或英文)以获得最佳网站性能。其他 MathWorks 国家/地区网站并未针对您所在位置的访问进行优化。
美洲
- América Latina (Español)
- Canada (English)
- United States (English)
欧洲
- Belgium (English)
- Denmark (English)
- Deutschland (Deutsch)
- España (Español)
- Finland (English)
- France (Français)
- Ireland (English)
- Italia (Italiano)
- Luxembourg (English)
- Netherlands (English)
- Norway (English)
- Österreich (Deutsch)
- Portugal (English)
- Sweden (English)
- Switzerland
- United Kingdom (English)