plotInteraction
Plot interaction effects of two predictors in linear regression model
Syntax
Description
plotInteraction(
creates a plot of the main effects of the
two selected predictors mdl,var1,var2)var1 and var2 and
their conditional effects
in the linear regression model mdl. Horizontal lines through
the effect values indicate their 95% confidence intervals.
h = plotInteraction(___)h. Use h
to modify the properties of a specific line after you create the plot. For a list of
properties, see Line Properties.
Examples
Fit a model with an interaction term and create an interaction plot that shows the main effects and conditional effects.
Using the data in the carsmall data set, create response values that include an interaction term. First, load the data set and normalize the predictor data.
load carsmall
Acceleration = normalize(Acceleration);
Horsepower = normalize(Horsepower);
Displacement = normalize(Displacement);
Define a response variable that includes the interaction term Acceleration*Horsepower.
y = Acceleration + 4*Horsepower + Acceleration.*Horsepower + Displacement;
Add some noise to the response values.
rng('default') % For reproducibility
y = y + normrnd(10,0.25*std(y,'omitnan'),size(y));
Create a table that includes the predictor data and response values.
tbl = table(Acceleration,Horsepower,Displacement,y);
Fit a linear regression model.
mdl = fitlm(tbl,'y ~ Acceleration + Horsepower + Acceleration*Horsepower + Displacement + Horsepower*Displacement')mdl =
Linear regression model:
y ~ 1 + Acceleration*Horsepower + Horsepower*Displacement
Estimated Coefficients:
Estimate SE tStat pValue
__________ _______ _________ __________
(Intercept) 9.8652 0.16177 60.982 8.587e-77
Acceleration 0.63726 0.1626 3.9191 0.00016967
Horsepower 3.6168 0.34 10.638 9.273e-18
Displacement 0.95032 0.31828 2.9858 0.0036144
Acceleration:Horsepower 0.60108 0.1851 3.2473 0.0016209
Horsepower:Displacement -0.0096069 0.20947 -0.045863 0.96352
Number of observations: 99, Error degrees of freedom: 93
Root Mean Squared Error: 1.07
R-squared: 0.93, Adjusted R-Squared: 0.927
F-statistic vs. constant model: 249, p-value = 3.3e-52
pValue of the interaction term Acceleration*Horsepower is very small, meaning that the interaction term is statistically significant.
Create an interaction plot that shows the main effects and conditional effects of Horsepower and Acceleration.
plotInteraction(mdl,'Horsepower','Acceleration')
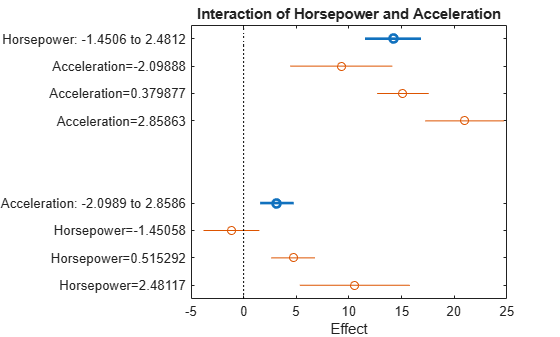
For each predictor, the main effect point and its conditional effect points are not vertically aligned. Therefore, you cannot find any vertical lines that pass through the confidence intervals of the main and conditional effect points for each predictor. This plot indicates the existence of interaction effects on the response variable.
For comparison, create an interaction plot for Displacement and Horsepower. This p-value of this interaction term (Displacement*Horsepower) is large, meaning that the interaction term is not statistically significant.
plotInteraction(mdl,'Displacement','Horsepower')
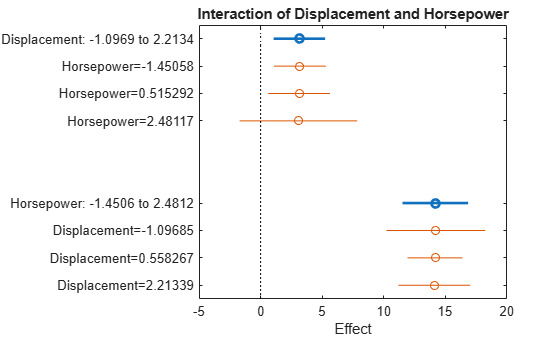
For each predictor, the main effect point and its conditional effect points are aligned vertically. This plot indicates no interaction.
Fit a model with an interaction term and create an interaction plot of adjusted response curves.
Using the data in the carsmall data set, create response values that include an interaction term. First, load the data set and normalize the predictor data.
load carsmall
Acceleration = normalize(Acceleration);
Horsepower = normalize(Horsepower);
Displacement = normalize(Displacement);
Define a response variable that includes the interaction term Acceleration*Horsepower.
y = Acceleration + 4*Horsepower + Acceleration.*Horsepower + Displacement;
Add some noise to the response values.
rng('default') % For reproducibility
y = y + normrnd(10,0.25*std(y,'omitnan'),size(y));
Create a table that includes the predictor data and response values.
tbl = table(Acceleration,Horsepower,Displacement,y);
Fit a linear regression model.
mdl = fitlm(tbl,'y ~ Acceleration + Horsepower + Acceleration*Horsepower + Displacement + Horsepower*Displacement')mdl =
Linear regression model:
y ~ 1 + Acceleration*Horsepower + Horsepower*Displacement
Estimated Coefficients:
Estimate SE tStat pValue
__________ _______ _________ __________
(Intercept) 9.8652 0.16177 60.982 8.587e-77
Acceleration 0.63726 0.1626 3.9191 0.00016967
Horsepower 3.6168 0.34 10.638 9.273e-18
Displacement 0.95032 0.31828 2.9858 0.0036144
Acceleration:Horsepower 0.60108 0.1851 3.2473 0.0016209
Horsepower:Displacement -0.0096069 0.20947 -0.045863 0.96352
Number of observations: 99, Error degrees of freedom: 93
Root Mean Squared Error: 1.07
R-squared: 0.93, Adjusted R-Squared: 0.927
F-statistic vs. constant model: 249, p-value = 3.3e-52
pValue of the interaction term Acceleration*Horsepower is very small, meaning that the interaction term is statistically significant.
Create an interaction plot that shows the adjusted response function as a function of Acceleration, with Horsepower fixed at specific values.
plotInteraction(mdl,'Horsepower','Acceleration','predictions')
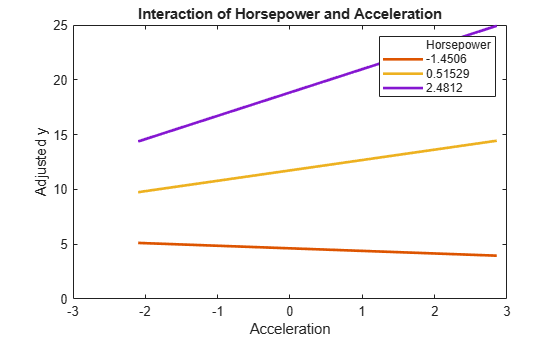
The curves are not parallel. This plot indicates interactions between the predictors.
For comparison, create an interaction plot for the Displacement and Horsepower. The p-value of this interaction term (Displacement*Horsepower) is large, meaning that the interaction term is not statistically significant.
plotInteraction(mdl,'Displacement','Horsepower','predictions')
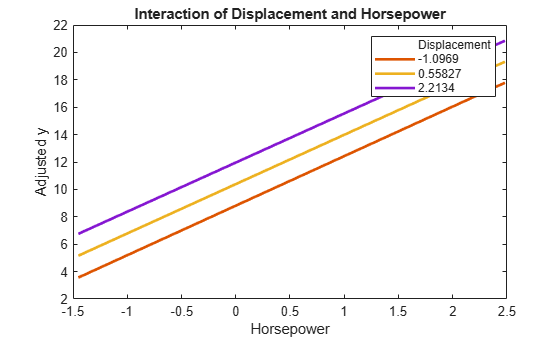
The curves are parallel, indicating no interaction.
Input Arguments
Output Arguments
More About
Tips
The data cursor displays the values of the selected plot point in a data tip (small text box located next to the data point). The data tip includes the x-axis and y-axis values for the selected point, along with the observation name or number.
Alternative Functionality
A
LinearModelobject provides multiple plotting functions.When creating a model, use
plotAddedto understand the effect of adding or removing a predictor variable.When verifying a model, use
plotDiagnosticsto find questionable data and to understand the effect of each observation. Also, useplotResidualsto analyze the residuals of the model.After fitting a model, use
plotAdjustedResponse,plotPartialDependence, andplotEffectsto understand the effect of a particular predictor. UseplotInteractionto understand the interaction effect between two predictors. Also, useplotSliceto plot slices through the prediction surface.