Test Trained Models in Classification Learner or Regression Learner
After training several models in Classification Learner or Regression Learner, you can view their validation metrics using the Results Table and the Compare Results plot to find the best model. After you identify the best model, the recommended approach is to compute model performance metrics using a test data set, which doesn't contain any observations used to train the models. You can test a trained model to:
Assess performance in real-world scenarios where the model encounters unseen data.
Check for overfitting, where the model performs well on training data but poorly on new data.
Compare the performance of the trained model to imported trained models, using the same data set.
Import Test Data
You can import a test data set into the app using one of these methods:
From the MATLAB command line — When you launch the app from the command line, specify a data set variable in the workspace and a portion of the data to set aside as a test data set. The app uses the remaining portion of the data as the training data set to train new models and compute validation metrics. For more information, see Classification Learner and Regression Learner.
At the start of a new session — In the Test section of the New Session dialog box, click the check box to set aside a test data set. Specify the percentage of the imported data to use as a test data set. The app uses the remaining portion of the data as the training data set to train new models and compute validation metrics.
During the current session — In the Data section of the Test tab, click Import Test Data and select From Workspace or From Data File. The test data set must have the same variables as the predictors in the current session's training data set. The unique classes in the test response variable must be a subset of the classes in the current session's response variable. When you import a new test data set, it replaces any existing test data set in the current session, and the app removes any existing test results.
Compute Test Metrics
To test a model (that is, compute test metrics), select a trained model in the Models pane, and click Test Selected in the Test section of the Test tab. Alternatively, you can test all trained models by clicking Test All.
If you test more than one model on the same test data set, the Testing Multiple Models dialog box opens.
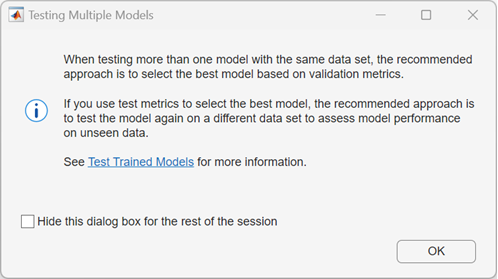
In machine learning, the recommended workflow is to select the best model using validation metrics, and then compute test metrics only for the best model to assess how it performs on unseen data. Selecting the best model on the basis of test metrics can introduce a selection bias and defeat the purpose of validation, because the best model might perform well on the test data set purely by chance. If you select the best model based on test metrics, the recommended approach is to test the model again on a different test data set to assess its performance on unseen data. Note that when you import a new test data set, the app removes any previous test results.
In some cases, you might want to compare the performance of an imported trained model to your best trained model in the app. In this case, you can test each model using the same test data set and compare their test results. If you select the best model using this method, the recommended approach is to test the best model again on a different test data set to assess its performance on unseen data.
Display and Plot Test Results
After you test a model, the app displays the test metrics in the Test Results section of the Summary tab. You can directly compare the validation and test metrics for multiple models in the Results Table to check if the validation metrics give good estimates for the test metrics.
To visualize test results in Classification Learner, select one of the following plots in the Plots and Results section on the Test tab:
Confusion Matrix (Test) — Display a confusion matrix of true class versus predicted class.
ROC Curve (Test) — Display a receiver operating characteristics (ROC) plot. For more information, see Check ROC Curve.
Precision-Recall (Test) — Display a precision-recall plot. For more information, see Check Precision-Recall Curve.
Compare Results — To compare test results for multiple models, select a test metric in the Plot Data section of the Compare Results plot.
Compare ROC Curves — To compare ROC curves for multiple models, select Test in the Data section of the Compare ROC Curves plot.
To visualize test results in Regression Learner, select one of the following plots in the Plots and Results section on the Test tab:
Predicted vs. Actual (Test) — Display a predicted versus actual response plot. For more information, see Plot Predicted vs. Actual Response.
Residuals (Test) — Display a residuals plot that shows the difference between the predicted and true responses. For more information, see Evaluate Model Using Residuals Plot.
Compare Results — To compare test results for multiple models, select a test metric in the Plot Data section of the Compare Results plot.
See Also
Topics
- Check Classifier Performance Using Test Data Set in Classification Learner App
- Check Model Performance Using Test Data Set in Regression Learner App
- Train Classifier Using Hyperparameter Optimization in Classification Learner App
- Train Regression Model Using Hyperparameter Optimization in Regression Learner App