仿真、可视化和验证活动图
将系统描述为活动图后,您可以可视化令牌的流,并跟踪活动的执行情况。要验证活动图是否满足设计目标,请仿真模型,使用动画验证图的行为,并使用仿真数据检查器可视化模型的输出。有关活动图的更多信息,请参阅使用活动图描述系统行为。
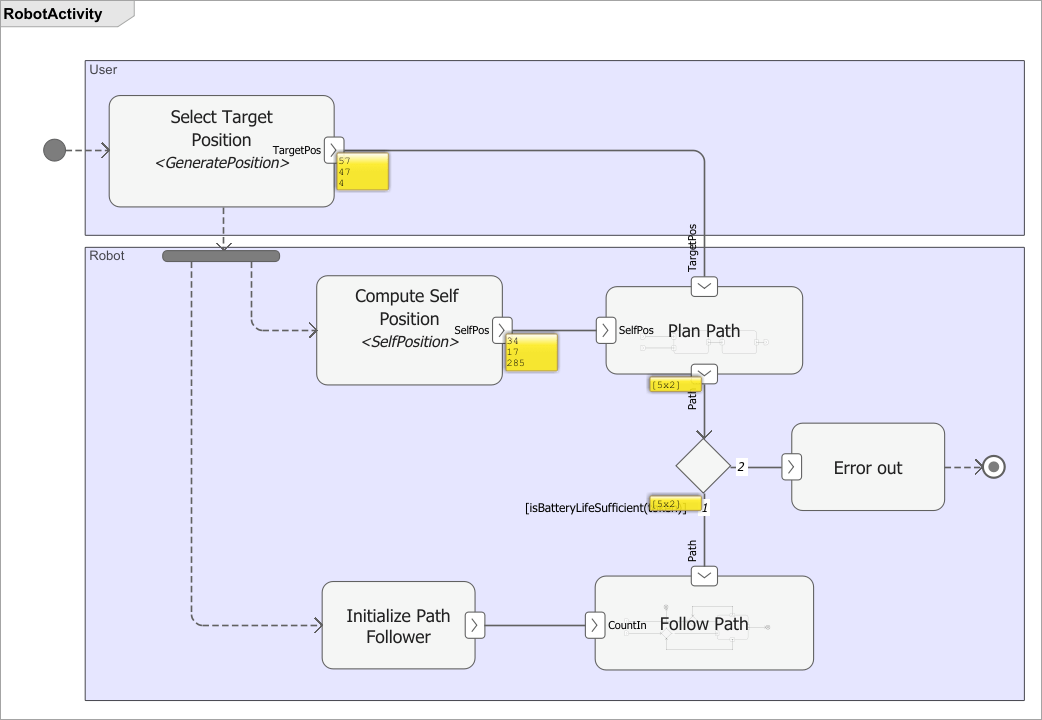
在此示例中,活动图表示移动机器人的路径规划算法。活动图包括:
Select Target Position动作节点表示机器人在网格中的目标位置。Plan Path动作节点根据来自Select Target Position节点的目标位置和来自Compute Self Position节点的初始位置计算机器人的路径。合并节点检查计算出的路径是否与计划路径和剩余机器人电池寿命相匹配。
如果路径可行,则在
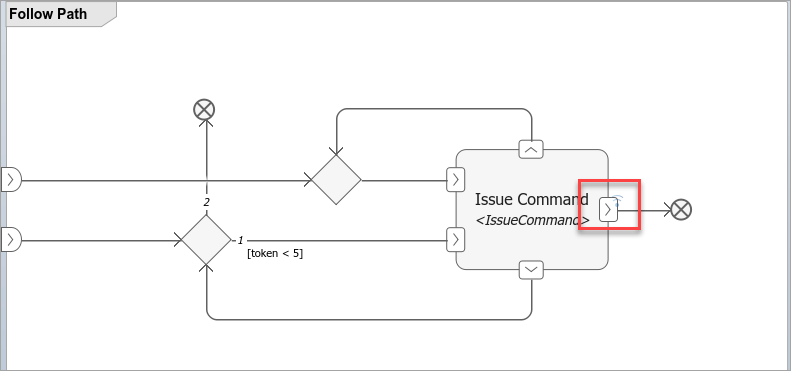
Follow Path动作节点中,机器人发出适当的命令并执行这些命令以到达目标位置。如果路径不可行,则图会显示错误。
有关创建此活动图的更多信息,请参阅编写活动图。
打开移动机器人的活动图功能流程
此示例显示了用于建模在随机起点和目的地之间移动的移动机器人架构的功能流程图。
打开工程。
openProject("scMobileRobotExample");打开活动图。
systemcomposer.openModel("RobotActivity");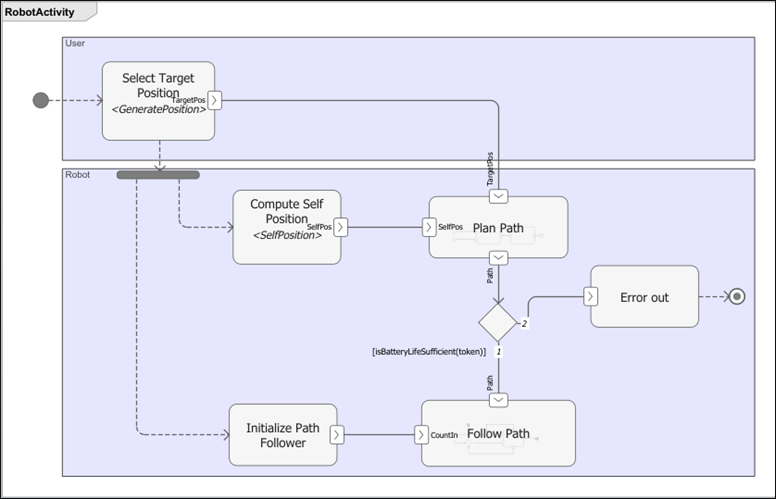
首先,机器人软件计算路径距离。如果距离超过机器人电池的续航能力,令牌将流向 Error out,活动终止。否则,机器人将沿路径前进。
仿真活动图并审查结果
要仿真活动图,在 System Composer™ 工具条的建模选项卡中,使用仿真部分。
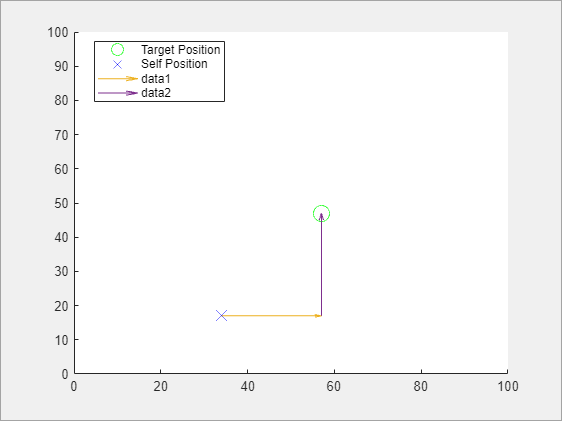
仿真活动图后,观察机器人是否沿着路径行驶,并在路径可行时到达目的地。在这个简单的路径规划算法中,机器人首先在水平轴上移动,使其 x 坐标与目标对齐,然后在垂直轴上移动,使其 y 坐标与目标位置对齐。然后,机器人调整其方向与目标位置对齐。
请注意,当令牌到达 Activity Final Node 节点时,仿真结束。
注意
活动图仿真以两种情况之一结束:令牌到达活动终止节点,或者仿真时间到期。
使用动画验证活动图的行为
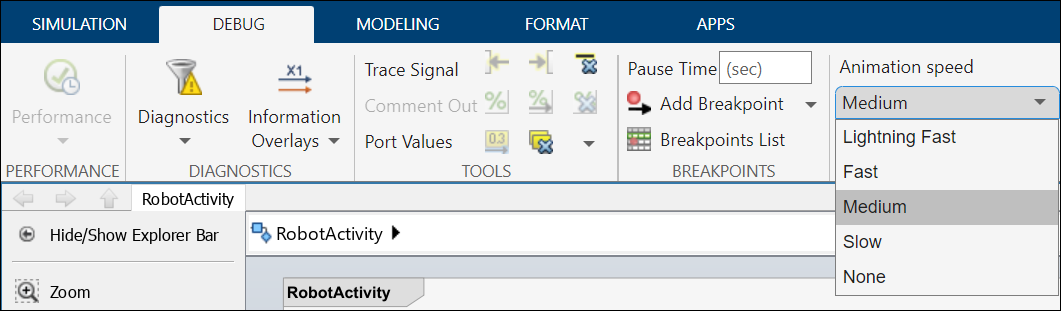
要跟踪令牌的流动和活动的执行情况,请使用动画。动画突出显示令牌的流动和活动图中的操作序列。要指定动画的速度,在 System Composer 工具条上的调试选项卡中,将动画速度设置为极快、快速、中速、慢速或无。
如果动画正在播放,要停止仿真中的动画,请按 Ctrl+C 或将动画速度设置为无。
动画显示机器人的活动图。动画以边框颜色突出显示动作节点和引脚,这些颜色代表它们在仿真期间的状态。
动作节点的动画有两种边框颜色:
深灰色 - 动作节点已完成执行。
绿色 - 动作节点正在运行。
引脚动画有两种边框颜色:
橙色 - 一些令牌已到达引脚,但引脚不符合令牌多重性运行的需求。
绿色 - 满足所有与令牌相关的需求,引脚正在等待其他引脚或执行操作。
注意
打开动画可能会导致点击停止按钮时出现延迟。此延迟发生是因为软件需要完成所有已发生事件的动画效果。为了缩短仿真时间,您可以关闭动画。
使用仿真数据检查器从活动图中记录数据
要可视化来自节点的输出令牌和数据,请右键点击对象流线,记录信号,然后使用 仿真数据检查器。

在机器人的活动图中,在 Follow Path 动作节点中记录发出的命令。
对图进行仿真。在工具栏的仿真选项卡上,点击数据检查器。仿真数据检查器显示记录的数据。

使用引脚值显示查看令牌数据
您可以将节点输出引脚上的令牌数据值和结构以标签的形式显示在图中的流线之上。当令牌离开输出引脚时,标签中的值将更新。在仿真之前和仿真过程中,您可以在整个模型中添加和删除引脚值标签。您可以使用引脚值标签以及其他可视化选项来理解、分析和调试图。
要显示令牌数据,在机器人示例中,右键点击流程线,然后选择在所选信号上显示端口值标签。请注意,在动画期间和之后,引脚值都会显示出来。
注意
端口值标签无法访问使用 MATLAB 类令牌的流。
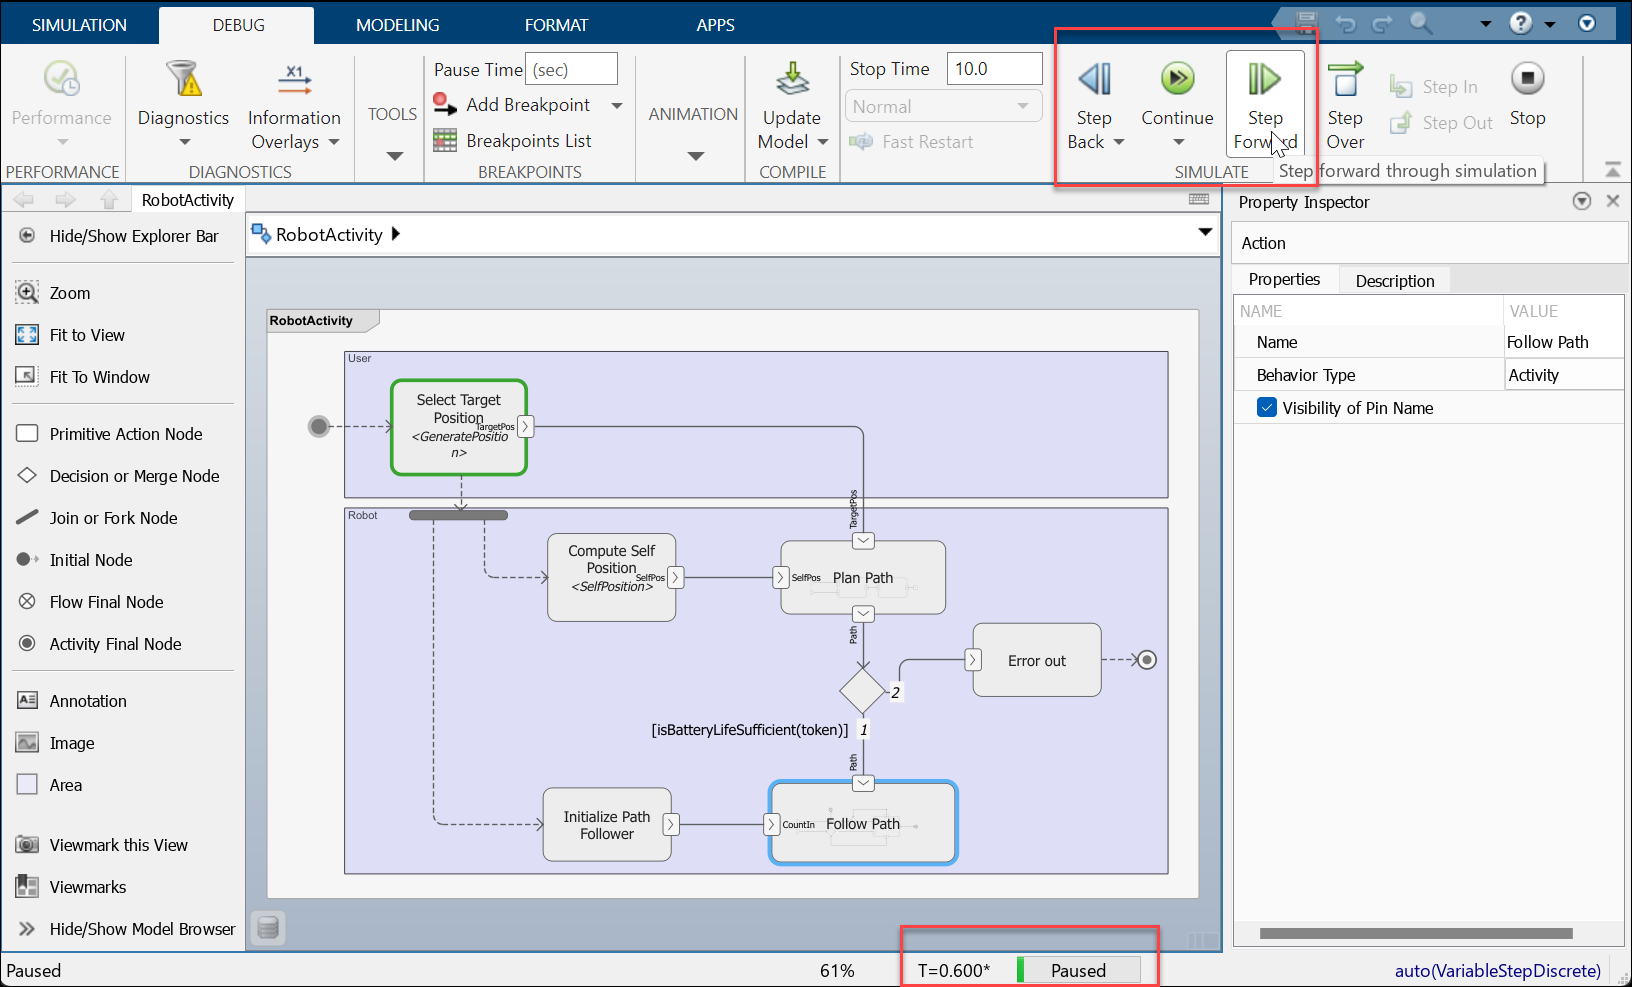
逐步仿真
您可以逐步执行仿真的主要时间步,以分析和调试图的行为。在工具栏的调试选项卡中,使用步进和步退按钮。请注意,仿真在每个主要时间步都会暂停。
注意
为了能够逐步执行时间步骤,您需要在活动图中为节点指定非零持续时间。否则,仿真将在一个时间步长后结束。
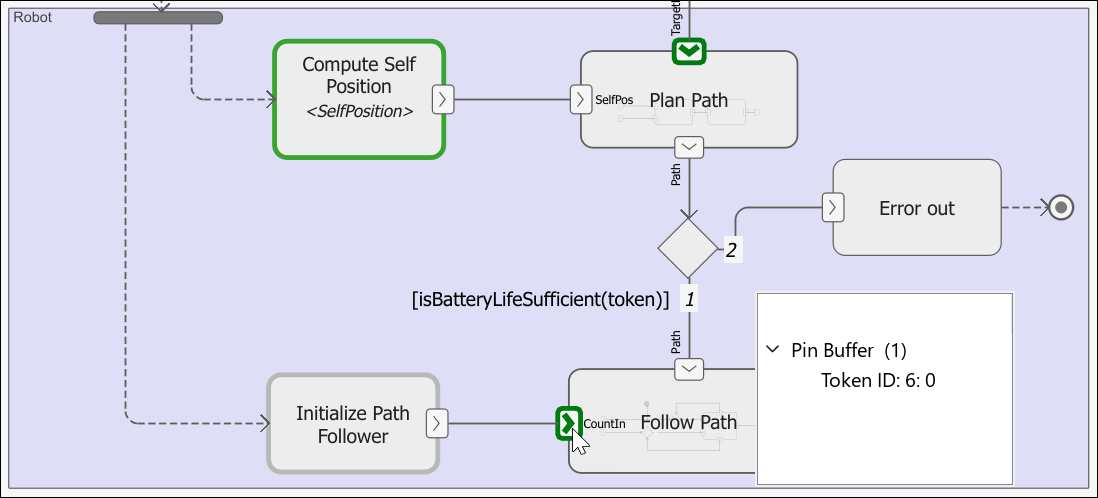
使用令牌检查器检查令牌
您可以在仿真过程中使用令牌检查器检查引脚或参数节点的内容。当您暂停仿真并选择引脚或参数节点时,令牌检查器会显示信息,例如令牌数量以及每个令牌的令牌 ID 和令牌有效负载。使用令牌检查器来调试与令牌排队和模块行为有关的问题。
您一次只能访问一个引脚或参数节点的令牌检查器。
要显示令牌检查器,请逐步执行仿真,然后点击要检查的引脚。引脚缓冲区中的令牌与它们的令牌 ID 一起显示。每个令牌 ID 都是唯一的,并自动生成。您可以使用令牌 ID 在仿真中跟踪令牌。
另请参阅
函数
工具
模块
- Initial Node | Action Node | Pin | Parameter Node | Decision or Merge Node | Join or Fork Node | Flow Final Node | Activity Final Node