测量和统计
双态波形测量、方差、直方图、自相关性
您可以使用 DSP System Toolbox™ 的模块和 System object 在 MATLAB® 和 Simulink® 中测量信号的移动统计量和静态统计量。移动统计量指随时间而变化的流信号的统计量。在计算移动统计量的滑动窗方法中,当新数据进入时,指定长度的窗逐样本地在数据上移动。这些对象和模块用于计算此窗内的数据统计量。指数加权方法将一组权重应用于数据样本并处理加权数据。这些权重是基于数据的使用年限以递归方式计算的。对于静态统计量,模块和对象计算一个批量中可用的所有数据的统计量。
对象
模块
主题
移动统计量
- What Are Moving Statistics?
Learn how moving statistics are calculated. - Sliding Window Method and Exponential Weighting Method
Learn the differences between the sliding window method and exponential weighting method. - 移动平均滤波器与 FIR 滤波器有何不同?
移动平均滤波器是 FIR 滤波器的特例。 - Measure Statistics of Streaming Signals
Compute the moving average of streaming signals using MATLAB functions and System objects. - 计算含噪阶跃信号的移动平均值
在 Simulink 中使用 Moving Average 模块比较滑动窗平均值计算方法和指数加权平均值计算方法。 - 计算含噪阶跃信号的移动 RMS
使用滑动窗方法和指数加权方法计算移动 RMS。 - Compute Moving Standard Deviation of Noisy Square Wave Signal
Compare the sliding window standard deviation method and the exponentially weighted standard deviation method in Simulink using the Moving Standard Deviation block. - Compute Moving Variance of Noisy Square Wave Signal
Compare the sliding window variance method and the exponentially weighted variance method in Simulink using the Moving Variance block.
静态统计量
- 计算均值
Simulink 模型示例,使用 Mean 模块计算均值。 - 使用滑动窗计算均值
使用 Buffer 模块对滑动窗进行建模。Mean 模块使用此窗计算均值。 - 计算滚动均值
Simulink 模型示例,使用 Mean 模块计算滚动均值。 - 计算最大值
使用 Maximum 模块计算最大值的 Simulink 模型示例。 - 计算滚动最大值
使用 Maximum 模块计算滚动最大值的 Simulink 模型示例。 - 计算最小值
使用 Minimum 模块计算最小值的 Simulink 模型示例。 - Compute the Running Minimum
Simulink model example to compute the running minimum using the Minimum block. - 计算含噪阶跃信号的 RMS
使用 RMS 模块计算含噪方波信号的 RMS。 - Compute the Histogram of Real and Complex Data
Simulink model example that explains how the histogram bin boundaries are calculated based on the input. - 计算标准差
使用 Standard Deviation 模块计算标准差。 - 计算滚动标准差
使用 Standard Deviation 模块计算滚动标准差。 - 计算方差
使用 Variance 模块计算方差。
功率测量值
- Compute Power Measurements of Voltage Signal in Simulink
Compute average power, peak power, and peak-to-average power ratio of voltage signal. - Compute CCDF Measurements of Voltage Signal in Simulink
Compute relative power and probability, and plot the CCDF curve in Array Plot.
应用
- Remove High-Frequency Noise from Gyroscope Data
Remove high-frequency noise using a median filter. - Energy Detection in the Time Domain
Detect the event when the signal energy crosses a particular threshold value.
可变大小信号支持
- Variable-Size Signal Support DSP System Objects
List of System objects that support variable-sized signals in DSP System Toolbox.
精选示例

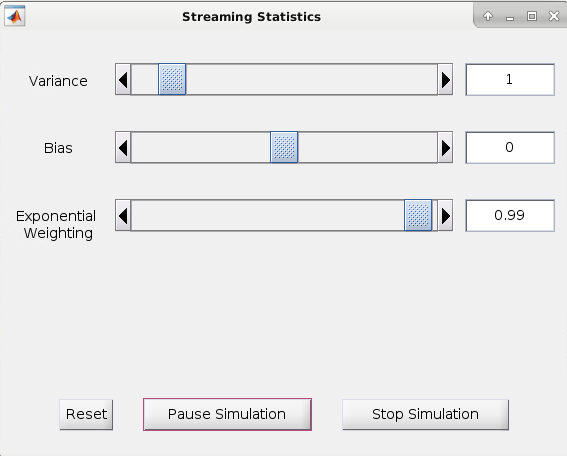
Streaming Signal Statistics
Perform statistical measurements on an input data stream using DSP System Toolbox™ functionality available at the MATLAB® command line. Compute the signal statistics minimum, maximum, mean, variance and peak-to-RMS and the signal power spectrum density and plot them.
Generate Standalone Executable and Interact with It Using UDP
Generate a standalone executable for streaming statistics using MATLAB® Coder™ and tune the generated executable using a user interface (UI) that is running in MATLAB®.