view3d
Description
Add-On Required: This feature requires the Optical Design and Simulation Library for Image Processing Toolbox add-on.
view3d( plots the optical system
opsys)opsys in 3-D.
view3d(
specifies properties of the visualization using one or more optional name-value arguments.
For example, opsys,Name=Value)Title="CookeTriplet" sets the title of the plot to
"CookeTriplet".
osv3d = view3d(___)OpticalSystemViewer3D object osv3d, using any combination
of input arguments from previous syntaxes. You can customize the visualization by modifying
the properties of osv3d and using its object functions.
Examples
Create a simple optical system.
opsys = opticalSystem;
addRefractiveSurface(opsys,Radius=9,Material=[1.74 25.4],DistanceToNext=3)
addRefractiveSurface(opsys,Radius=-9,DistanceToNext=10)
addImagePlane(opsys)
Visualize the optical system in 3-D.
osv3d = view3d(opsys,Title="Convex Lens")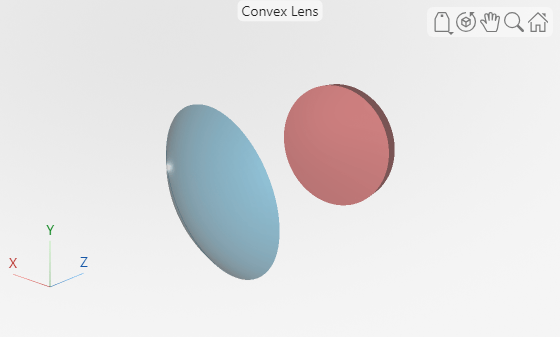
osv3d =
  OpticalSystemViewer3D with properties:

              Title: [0×0 string]
             Labels: "none"
          ClipAngle: 0
               Rays: [0×0 optics.ui.Rays3D]
    BackgroundColor: [0.9608 0.9608 0.9608]
      GradientColor: [0.9020 0.9020 0.9020]
             Parent: [1×1 Figure]

  Show all properties
Trace rays in the optical system to add to the visualization. Observe that rays contains three ray bundles.
rays = traceRays(opsys)
rays=1×3 RayBundle array with properties:
    1×1 RayBundle    1×1 RayBundle    1×1 RayBundle
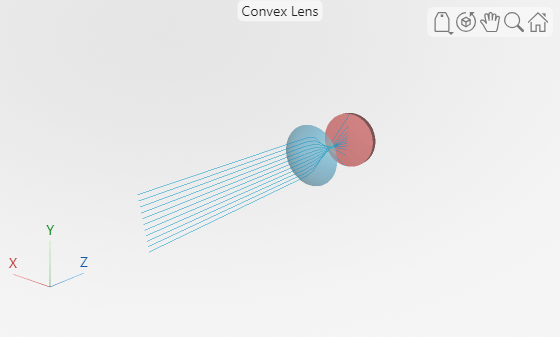
You can add only one ray bundle to a 3-D visualization. Add one of the ray bundles from the traced rays to the visualization.
addRays(osv3d,rays(1))
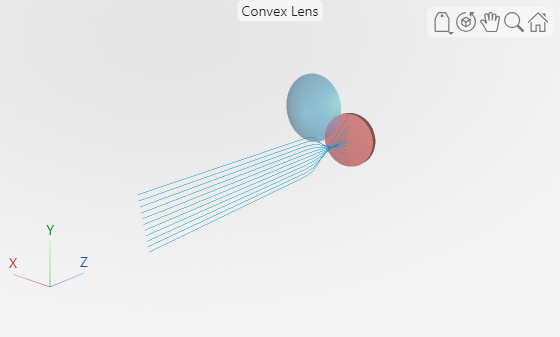
Explode the visualization. The explosion moves each component in the optical system visualization radially outward to enable you to better visualize the internal structure of the optical system.
explode(osv3d)
Restore the visualization to its state before the explosion.
unexplode(osv3d)

Show only the lens element, which is the first optical component, in the visualization.
showComponents(osv3d,1)
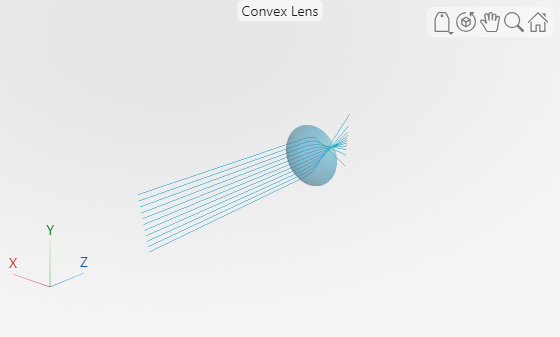
Remove the rays from the visualization.
removeRays(osv3d)

Add component labels to the visualization.
osv3d.Labels = "component";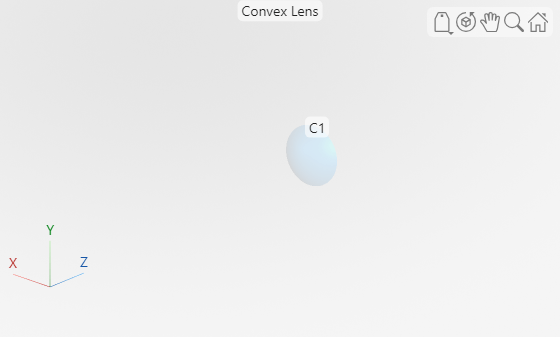
Input Arguments
Name-Value Arguments
Specify optional pairs of arguments as
Name1=Value1,...,NameN=ValueN, where Name is
the argument name and Value is the corresponding value.
Name-value arguments must appear after other arguments, but the order of the
pairs does not matter.
Example: view3d(opsys,Title="Cooke Triplet") names the visualization
as "Cooke Triplet".
Title of the visualization, specified as a string scalar or character vector.
Data Types: char | string
Type of labels, specified as one of these options.
"component"— The visualization displays labels for only the components in the optical system."surface"— The visualization displays labels for each individual surface in the optical system."none"— The visualization does not display any labels in the optical system.
Data Types: char | string
Clip angle in degrees, specified as a numeric scalar. The clip angle indicates the angle at which to clip the optical components in the visualization.
Data Types: single | double | int8 | int16 | int32 | int64 | uint8 | uint16 | uint32 | uint64
Background color, specified as an RGB triplet, a hexadecimal color code, or one of the color options listed in the table.
For a custom color, specify an RGB triplet or a hexadecimal color code.
An RGB triplet is a three-element row vector whose elements specify the intensities of the red, green, and blue components of the color. The intensities must be in the range
[0,1], for example,[0.4 0.6 0.7].A hexadecimal color code is a string scalar or character vector that starts with a hash symbol (
#) followed by three or six hexadecimal digits, which can range from0toF. The values are not case sensitive. Therefore, the color codes"#FF8800","#ff8800","#F80", and"#f80"are equivalent.
Alternatively, you can specify some common colors by name. This table lists the named color options, the equivalent RGB triplets, and the hexadecimal color codes.
| Color Name | Short Name | RGB Triplet | Hexadecimal Color Code | Appearance |
|---|---|---|---|---|
"red" | "r" | [1 0 0] | "#FF0000" |
|
"green" | "g" | [0 1 0] | "#00FF00" |
|
"blue" | "b" | [0 0 1] | "#0000FF" |
|
"cyan"
| "c" | [0 1 1] | "#00FFFF" |
|
"magenta" | "m" | [1 0 1] | "#FF00FF" |
|
"yellow" | "y" | [1 1 0] | "#FFFF00" |
|
"black" | "k" | [0 0 0] | "#000000" |
|
"white" | "w" | [1 1 1] | "#FFFFFF" |
|
"none" | Not applicable | Not applicable | Not applicable | No color |
Background gradient display, specified as "on" or
"off", matlab.lang.OnOffSwitchState.on or
matlab.lang.OnOffSwitchState.off, or as numeric or logical
1 (true) or 0
(false). A value of "on" is equivalent to a
logical on or true, and "off" is equivalent to a
logical off or false. Thus, you can use the value of this property
as a logical value. The value is stored as an on/off logical value of type matlab.lang.OnOffSwitchState.
If you specify BackgroundGradient as "on",
matlab.lang.OnOffSwitchState.on, or as a numeric or logical
1 (true), the function displays a background
gradient in the visualization.
Gradient color, specified as an RGB triplet, a hexadecimal color code, or one of the color options listed in the table.
For a custom color, specify an RGB triplet or a hexadecimal color code.
An RGB triplet is a three-element row vector whose elements specify the intensities of the red, green, and blue components of the color. The intensities must be in the range
[0,1], for example,[0.4 0.6 0.7].A hexadecimal color code is a string scalar or character vector that starts with a hash symbol (
#) followed by three or six hexadecimal digits, which can range from0toF. The values are not case sensitive. Therefore, the color codes"#FF8800","#ff8800","#F80", and"#f80"are equivalent.
Alternatively, you can specify some common colors by name. This table lists the named color options, the equivalent RGB triplets, and the hexadecimal color codes.
| Color Name | Short Name | RGB Triplet | Hexadecimal Color Code | Appearance |
|---|---|---|---|---|
"red" | "r" | [1 0 0] | "#FF0000" |
|
"green" | "g" | [0 1 0] | "#00FF00" |
|
"blue" | "b" | [0 0 1] | "#0000FF" |
|
"cyan"
| "c" | [0 1 1] | "#00FFFF" |
|
"magenta" | "m" | [1 0 1] | "#FF00FF" |
|
"yellow" | "y" | [1 1 0] | "#FFFF00" |
|
"black" | "k" | [0 0 0] | "#000000" |
|
"white" | "w" | [1 1 1] | "#FFFFFF" |
|
"none" | Not applicable | Not applicable | Not applicable | No color |
Parent UI container, specified as a Figure,
Panel, Tab, or GridLayout
object. By default, the function creates a new Figure object. You
can create these UI containers using their respective creation functions.
Figureobject —uifigurePanelobject —uipanelTabobject —uitabGridLayoutobject —uigridlayout
Output Arguments
Version History
Introduced in R2026a