主要内容

view2d

Visualize optical system in 2-D

Since R2026a

    Description

    Add-On Required: This feature requires the Optical Design and Simulation Library for Image Processing Toolbox add-on.

    view2d(opsys) plots the optical system opsys in 2-D in the ZY-plane. The horizontal axis, which is the optical axis of the optical system, is the Z-axis and the vertical axis is the Y-axis.

    view2d(opsys,Name=Value) specifies properties of the visualization using one or more optional name-value arguments. For example, Title="CookeTriplet" sets the title of the plot to "CookeTriplet".

    osv2d = view2d(___) returns the OpticalSystemViewer2D object osv2d, using any combination of input arguments from previous syntaxes. You can customize the visualization by modifying the properties of osv2d and using its object functions.

    example

    Examples

    collapse all

    Create a simple optical system.

    opsys = opticalSystem;
    addRefractiveSurface(opsys,Radius=9,Material=[1.74 25.4],DistanceToNext=3)
    addRefractiveSurface(opsys,Radius=-9,DistanceToNext=10)
    addImagePlane(opsys)
    focus(opsys);

    Visualize the optical system in 2-D.

    osv2d = view2d(opsys,Title="Convex Lens")
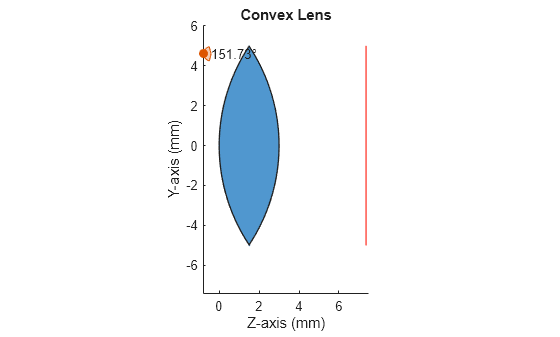
    Figure contains an object of type optics.ui.opticalsystemviewer2d. The chart of type optics.ui.opticalsystemviewer2d has title Convex Lens.

    osv2d = 
      OpticalSystemViewer2D with properties:
    
                Title: "Convex Lens"
        OpticalSystem: [1×1 opticalSystem]
               Labels: "none"
          FieldPoints: "on"
                 Rays: [0×0 optics.ui.Rays2D]
               Parent: [1×1 Figure]
    
      Show all properties


    Trace rays in the optical system to add to the visualization. Observe that rays contains three ray bundles.

    rays = traceRays(opsys)
    rays=1×3 RayBundle array with properties:
        FieldPoint
        Wavelength
        Sampling
        RayData


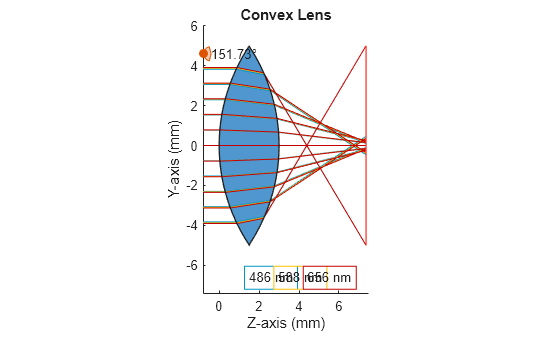
    Add the rays to the visualization. Each ray bundle is represented by a different color in the visualization.

    addRays(osv2d,rays)

    Figure contains an object of type optics.ui.opticalsystemviewer2d. The chart of type optics.ui.opticalsystemviewer2d has title Convex Lens.

    Remove the third ray bundle in the visualization.

    removeRays(osv2d,3)

    Figure contains an object of type optics.ui.opticalsystemviewer2d. The chart of type optics.ui.opticalsystemviewer2d has title Convex Lens.

    Add component labels to the visualization. The lens and image plane components are labeled as C1 and C2 in the visualization.

    osv2d.Labels = "component";
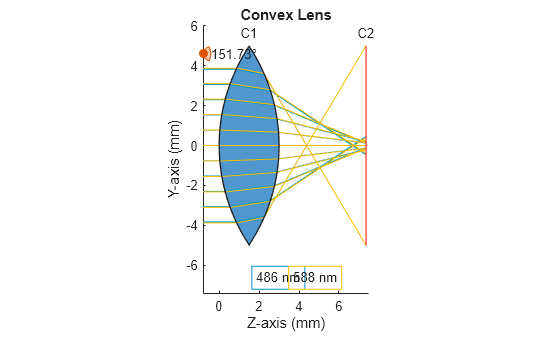
    Figure contains an object of type optics.ui.opticalsystemviewer2d. The chart of type optics.ui.opticalsystemviewer2d has title Convex Lens.

    Input Arguments

    collapse all

    Optical system to view, specified as an opticalSystem object.

    Name-Value Arguments

    collapse all

    Specify optional pairs of arguments as Name1=Value1,...,NameN=ValueN, where Name is the argument name and Value is the corresponding value. Name-value arguments must appear after other arguments, but the order of the pairs does not matter.

    Example: view2d(opsys,Title="Cooke Triplet") sets the title of the visualization to "Cooke Triplet".

    Rays in the visualization, specified as an array of Rays2D objects.

    Field points in visualization, specified as an array of Rays2D objects, specified as "on", "off", matlab.lang.OnOffSwitchState.on or matlab.lang.OnOffSwitchState.off, or as numeric or logical 1 (true) or 0 (false). A value of "on" is equivalent to a logical on or true, and "off" is equivalent to a logical off or false. Thus, you can use the value of this property as a logical value. The value is stored as an on/off logical value of type matlab.lang.OnOffSwitchState.

    By default, the function displays the field points of the optical system opsys in the visualization. If you specify FieldPoints as "off", matlab.lang.OnOffSwitchState.off, or as a numeric or logical 0 (true), the function does not display the field points in the visualization.

    For more information about defining field points, see Create Field Points.

    Title of the visualization, specified as a string scalar or character vector.

    Data Types: char | string

    Type of labels, specified as one of these options.

    • "component" — The visualization displays labels for only the components in the optical system.

    • "surface" — The visualization displays labels for each individual surface in the optical system.

    • "none" — The visualization does not display any labels in the optical system.

    • "both" — The visualization displays labels for each individual surface and each component in the optical system.

    Data Types: char | string

    Z-axis limits, specified as a 2-element numeric vector of the form [zmin zmax]. zmin and zmax are the lower and upper limits of the z-axis, respectively. The default value is adjusted to fit the optical system.

    Data Types: single | double | int8 | int16 | int32 | int64 | uint8 | uint16 | uint32 | uint64

    Y-axis limits, specified as a 2-element numeric vector of the form [ymin ymax]. ymin and ymax are the lower and upper limits of the y-axis, respectively. The default value is adjusted to fit the optical system.

    Data Types: single | double | int8 | int16 | int32 | int64 | uint8 | uint16 | uint32 | uint64

    Selection mode for the Z-axis limit, specified as one of these values:

    • "auto" — Enable automatic limit selection, which is based on the total span of the plotted data.

    • "manual" — Manually specify the axis limits. To specify the axis limits, set the YLim or ZLim property.

    Data Types: single | double | int8 | int16 | int32 | int64 | uint8 | uint16 | uint32 | uint64

    Selection mode for the Y-axis limit, specified as one of these values:

    • "auto" — Enable automatic limit selection, which is based on the total span of the plotted data.

    • "manual" — Manually specify the axis limits. To specify the axis limits, set the YLim or ZLim property.

    Data Types: single | double | int8 | int16 | int32 | int64 | uint8 | uint16 | uint32 | uint64

    Paraxial information display, specified as "on" or "off", matlab.lang.OnOffSwitchState.on or matlab.lang.OnOffSwitchState.off, or as numeric or logical 1 (true) or 0 (false). A value of "on" is equivalent to a logical on or true, and "off" is equivalent to a logical off or false. Thus, you can use the value of this property as a logical value. The value is stored as an on/off logical value of type matlab.lang.OnOffSwitchState.

    If you specify ParaxialInfo as "on", matlab.lang.OnOffSwitchState.on, or as a numeric or logical 1 (true), the function displays the paraxial information in the visualization.

    Data Types: single | double | int8 | int16 | int32 | int64 | uint8 | uint16 | uint32 | uint64 | logical

    Parent UI container, specified as a Figure, Panel, Tab, or GridLayout object. By default, the function creates a new Figure object. You can create these UI containers using their respective creation functions.

    Output Arguments

    collapse all

    2-D optical system viewer chart, returned as an OpticalSystemViewer2D object. You can customize the visualization by modifying the properties of osv2d and using its object functions.

    Version History

    Introduced in R2026a