主要内容

samplingGrid

Create ray sampling grid for entrance surface of optical system

Since R2026a

    Description

    Add-On Required: This feature requires the Optical Design and Simulation Library for Image Processing Toolbox add-on.

    A samplingGrid object creates a sampling grid in the xy-plane of the local surface coordinate frame, that defines the initial positions and angles of rays entering the optical system through the entrance pupil or first surface.

    You can specify the sampling grid as a fixed shape, such as a uniformly sampled square or hexapolar pattern, or as a random grid of points. You can also specify a custom sampling grid using x- and y-coordinates. The coordinates you specify must be normalized to the range [–1, 1], where the coordinate [0 0] defines the center of the entrance surface.

    Note

    This functionality requires the Optical Design and Simulation Library for Image Processing Toolbox™. You can install the Optical Design and Simulation Library for Image Processing Toolbox from Add-On Explorer. For more information about installing add-ons, see Get and Manage Add-Ons.

    Creation

    Description

    Specify Sampling Grid Shape

    sg = samplingGrid creates a sampling grid with 11 evenly spaced coordinate points along the y-axis at x = 0.

    sg = samplingGrid("Square") creates a square sampling grid with 11 coordinate points per side.

    example

    sg = samplingGrid("Square",numPointsPerSide) creates a square sampling grid with numPointsPerSide points per side.

    sg = samplingGrid("Hexapolar") creates a hexapolar sampling grid with 8 concentric rings of coordinate points.

    example

    sg = samplingGrid("Hexapolar",numRings) creates a hexapolar sampling grid with numRings concentric rings of coordinate points.

    example

    sg = samplingGrid("Random") creates a randomly spaced sampling grid containing 100 points.

    sg = samplingGrid("Random",numPoints) creates a randomly spaced sampled grid with numPoints points.

    sg = samplingGrid("Stratified") creates a stratified sampling grid with 11 points per side. This grid type contains an even distribution of points across the sampling area but introduces random variation within each grid cell.

    sg = samplingGrid("Stratified",numPointsPerSide) creates a stratified sampling grid with numPointsPerSide points per side.

    Specify Custom Grid Coordinates

    sg = samplingGrid(xcoord,ycoord) creates a custom sampling grid by exhaustively combining normalized x-coordinates xcoord and y-coordinates ycoord.

    example

    sg = samplingGrid(xycoord) creates a custom sampling grid using the normalized (x, y) grid point coordinates.

    Input Arguments

    expand all

    Number of coordinate points to sample per side of the square or stratified grid, specified as a positive integer.

    Number of circular rings to sample in the hexapolar grid, specified as a positive integer. Each circular ring R contains 6(R-1) grid points, where R is greater than one and corresponds to the number of the ring, in ascending order.

    Number of points sampled for a randomly spaced grid, specified as a positive integer.

    Normalized x-coordinates of sampling grid points, specified as an M-element numeric vector. M is the number of x-coordinates to sample. Each element of the vector is the value of an x-coordinate and must be in the range [–1, 1]. The samplingGrid object exhaustively combines the x-coordinates with the y-coordinates specified by the ycoord input argument into an M×N-by-2 matrix of grid point locations. N is the number of y-coordinates, specified using the ycoord input argument.

    Normalized y-coordinates of sampling grid points, specified as an N-element numeric vector. N is the number of y-coordinates to sample. Each element of the vector is the value of a y- coordinate and must be in the range [–1, 1]. The samplingGrid object exhaustively combines the y-coordinates with the x-coordinates specified by the xcoord input argument into an M×N-by-2 matrix of grid point locations. M is the number of x-coordinates, specified using the xcoord input argument.

    Normalized sampling grid coordinates, specified as an C-by-2 matrix. C is the number of grid points to sample. Each row of the matrix specifies the coordinates of a grid point in the form [x y]. Each element of the matrix must be in the range [–1, 1].

    Output Arguments

    expand all

    Sampling grid, returned as a samplingGrid object.

    Properties

    expand all

    Shape of the sampling grid, represented as a one of these values.

    • "Square"

    • "Hexapolar"

    • "Random"

    • "Stratified"

    • "Custom"

    Normalized coordinates of the sampling grid, represented as a C-by-2 matrix. The value of C, or the number of coordinate points in the form [x y], depends on the type of sampling grid you specify.

    Note

    The computed entrance pupil deviates from a perfect circle and can be elliptical depending on the location of the field points. The sampling grid attempts to sample the entrance pupil, with [0 0] as the center and [0 1] as the top. However, certain coordinates within the sampling grid may fall outside the entrance pupil. For instance, the [1 1] coordinate cannot reside within an ellipse or even a perfect circle.

    Examples

    collapse all

    Create a hexapolar sampling grid for ray tracing using the samplingGrid object.

    sg = samplingGrid("Hexapolar");

    Plot the (x,y) coordinates of the sampling grid by using the Coordinates property of the samplingGrid object.

    figure
    plot(sg.Coordinates(:,1),sg.Coordinates(:,2),"o");
    axis square

    Figure contains an axes object. The axes contains a line object which displays its values using only markers.

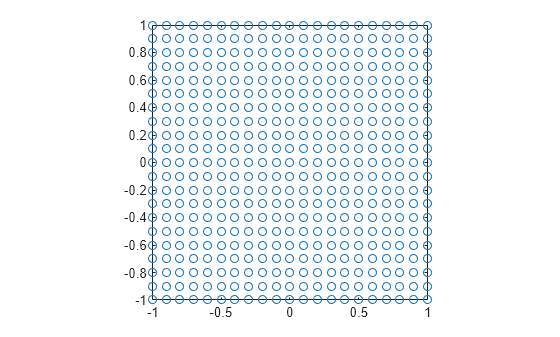
    Create a square sampling grid for ray tracing, with 21 grid points per side.

    sg = samplingGrid("Square",21);

    Plot the (x,y) coordinates of the sampling grid by using the Coordinates property of the samplingGrid object.

    figure
    plot(sg.Coordinates(:,1),sg.Coordinates(:,2),"o");
    axis square

    Figure contains an axes object. The axes contains a line object which displays its values using only markers.

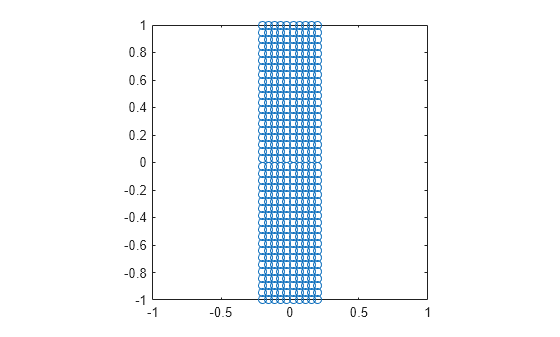
    Specify the x- and *y-*coordinates of a sampling grid for ray tracing.

    xcoords = linspace(-0.2,0.2,10);
    ycoords = linspace(-1,1,40);

    Create a custom sampling grid using the specified coordinates..

    sg = samplingGrid(xcoords,ycoords);

    Plot the *xy-*coordinates of the sampling grid by using the Coordinates property of the samplingGrid object.

    figure
    plot(sg.Coordinates(:,1),sg.Coordinates(:,2),"o")
    xlim([-1 1])
    ylim([-1 1])
    axis square
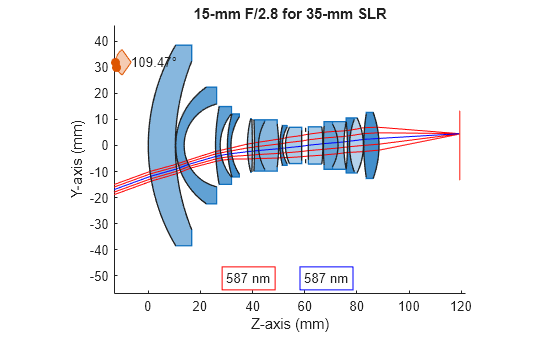
    Figure contains an axes object. The axes contains a line object which displays its values using only markers.

    Create an optical system that contains a fisheye lens using the createWideAngle helper function. The function is attached to this example as a supporting file.

    opsys = createWideAngle;

    Define a field angle representation of a light source at infinity, with a field angle of 20 degrees from the z-axis, using the fieldPoint function.

    fp = fieldPoint(Angles=[20 0]);

    Trace a chief ray through the optical system using the traceChiefRay object function.

    cr = traceChiefRay(opsys,FieldPoints=fp,Wavelengths=587);

    Define a hexapolar sampling grid of coordinate points, through which to sample traced rays, using the samplingGrid function.

    sg = samplingGrid("Hexapolar",6);

    Trace rays through the optical system using the traceRays object function. Specify the defined hexapolar sampling grid using the SamplingGrid name-value argument.

    rb = traceRays(opsys,FieldPoints=fp,Wavelength=587,SamplingGrid=sg);

    Display the optical system using the view2d object function, and visualize the traced rays through the system using the addRays object function. The chief and sample rays are visualized in blue and red, respectively.

    hv = view2d(opsys);
    addRays(hv,rb,Color="r")
    addRays(hv,cr,Color="b")

    Figure contains an object of type optics.ui.opticalsystemviewer2d. The chart of type optics.ui.opticalsystemviewer2d has title 15-mm F/2.8 for 35-mm SLR.

    Tips

    • When you specify a stratified sampling grid, the algorithm uses a random number generator to introduce randomness. To obtain reproducible results, set the random seed before generating the grid. To set the random seed, use the rng function before generating the stratified sampling grid.

    Algorithms

    expand all

    Version History

    Introduced in R2026a