Types of 2-D Geographic Plots
This table lists the functions you can use to plot data into geographic axes and map axes.
| Point Plots | Line and Polygon Plots | Raster Plots | Data Distribution Plots | Animations | Annotations |
|---|---|---|---|---|---|
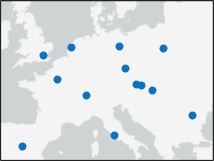
Display points using the |
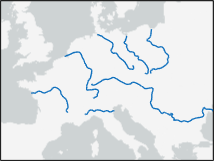
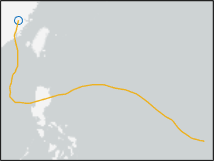
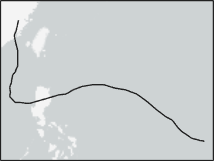
Display lines using the |
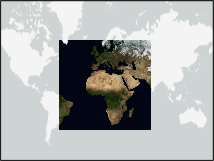
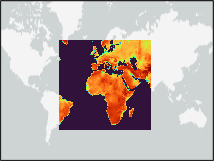
Display RGB and grayscale images using the
|
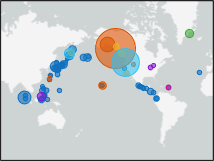
Create a bubble chart using the |
Create a comet plot using the |
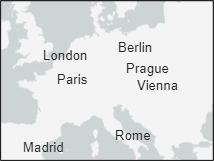
Display text using the |
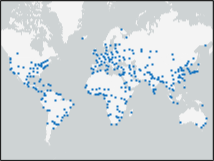
Create a scatter plot using the |
Display polygons using the |
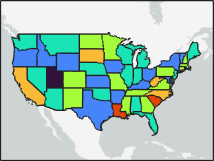
Create a pseudocolor raster plot using the
|
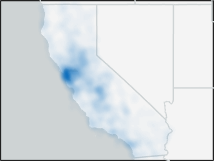
Create a density plot using the |
Create an animated line using the | |
Display icons using the |
Plot Data into Geographic Axes
When you plot data into a geographic axes, some functions require you to create the axes first.
Functions such as
geoplot,geoscatter, andgeopcolordo not require you to create the axes before plotting. If the current axes is not a geographic axes or map axes, or if there is no current axes, the functions create a new geographic axes before plotting.Functions such as
bubblechart,comet, andanimatedlineplot data using a Cartesian axes by default. To use these functions with a geographic axes, first create the geographic axes using one of these strategies:Plot geographic data using a function such as
geoplot,geoscatter, orgeopcolor.Set up a map with the specified basemap or geographic limits by using the
geobasemaporgeolimitsfunction, respectively.Use the
geoaxesfunction. Note that, if an axes already exists, thegeoaxesfunction adds a new geographic axes to the figure without removing existing axes.
Then, specify the axes as input to the plotting function, or set the hold state of the axes to
onby using theholdfunction.
For more examples that create maps using geographic axes, see:
Plot Data into Map Axes
To plot data into a map axes, you must create the map axes first. Create a map axes from
a projected coordinate reference system (CRS) by using the newmap function.
Specify the projected CRS by using a projcrs
object.
The strategy you use to plot data into the map axes depends on the function.
When the current axes is a map axes, functions such as
geoplot,geoscatter, andgeopcolorplot data using the map axes.By default, functions such as
bubblechart,comet, andanimatedlineplot data using a Cartesian axes. To use these functions with a map axes, specify the map axes as input to the plotting function, or set the hold state of the map axes toonby using theholdfunction.
For more examples that create maps using map axes, see: