Main Content

griddata

对二维或三维散点数据插值

说明

示例

vq = griddata(x,y,v,xq,yq) 使 v = f(x,y) 形式的曲面与向量 (x,y,v) 中的散点数据拟合。griddata 函数在 (xq,yq) 指定的查询点对曲面进行插值并返回插入的值 vq。曲面始终穿过 xy 定义的数据点。

示例

vq = griddata(x,y,z,v,xq,yq,zq) 拟合 v = f(x,y,z) 形式的超曲面。

vq = griddata(___,method) 使用上述语法中的任何输入参数指定计算 vq 所用的插值方法。method 可以是 "linear""nearest""natural""cubic""v4"。默认方法为 "linear"

[Xq,Yq,vq] = griddata(x,y,v,xq,yq)[Xq,Yq,vq] = griddata(x,y,v,xq,yq,method) 还返回 XqYq,其中包含查询点的网格坐标。

示例

全部折叠

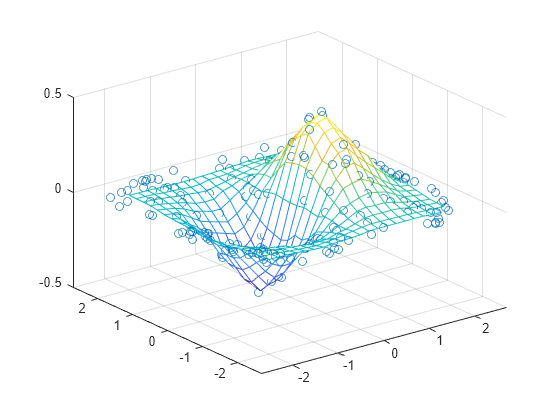
基于均匀查询点网格对随机分布的散点数据插值。

对函数介于 -2.52.5 之间的 200 个随机点采样。得到的向量 xyv 包含分散的采样点和这些点上的数据值。

rng default
xy = -2.5 + 5*rand([200 2]);
x = xy(:,1);
y = xy(:,2);
v = x.*exp(-x.^2-y.^2);

定义一个查询点网格,并基于该网格对散点数据插值。

[xq,yq] = meshgrid(-2:.2:2, -2:.2:2);
vq = griddata(x,y,v,xq,yq);

将网格数据绘制为网格,将散点数据绘制为点。

mesh(xq,yq,vq)
hold on
plot3(x,y,v,"o")
xlim([-2.7 2.7])
ylim([-2.7 2.7])

Figure contains an axes object. The axes object contains 2 objects of type surface, line. One or more of the lines displays its values using only markers

对四维函数随机采样散点的三维切片插值。

对四维函数 v(x,y,z) 介于 -11 之间的 2500 个随机点采样。向量 xyz 包含非均匀样本点。

x = 2*rand(2500,1) - 1; 
y = 2*rand(2500,1) - 1; 
z = 2*rand(2500,1) - 1;
v = x.^2 + y.^3 - z.^4;

创建一个在 [-1, 1] 范围内具有 xy 个点的网格,并设置 z=0。在这个二维查询点网格 (xq,yq,0) 上插值将产生四维数据集 (x,y,z,v) 的三维插值切片 (xq,yq,0,vq)

d = -1:0.05:1;
[xq,yq,zq] = meshgrid(d,d,0);

基于网格对散点数据插值。绘制结果。

vq = griddata(x,y,z,v,xq,yq,zq);
plot3(x,y,v,"ro")
hold on
surf(xq,yq,vq)
hold off

Figure contains an axes object. The axes object contains 2 objects of type line, surface. One or more of the lines displays its values using only markers

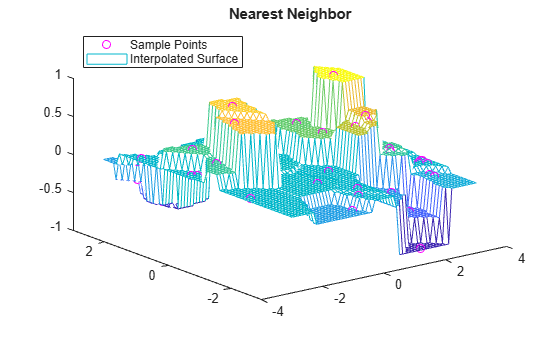
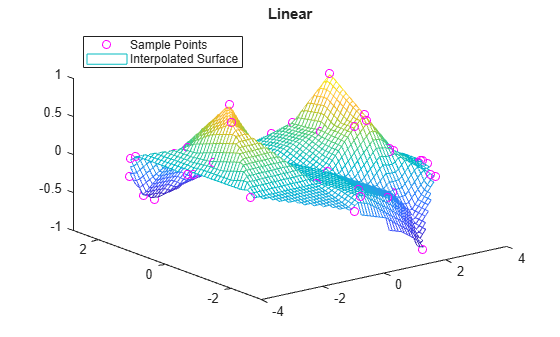
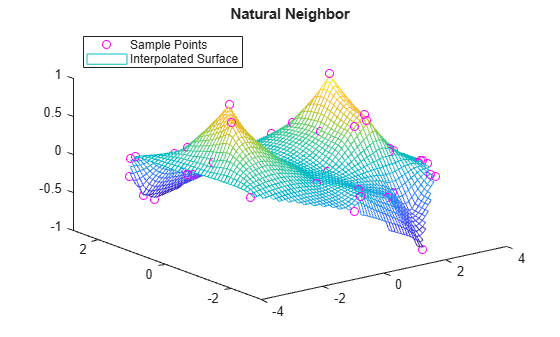
比较 griddata 提供的几种不同插值算法的结果。

创建包含 50 个散点的样本数据集。这里有意使用较少的点数量,目的是为了突出插值方法之间的差异。

x = -3 + 6*rand(50,1);
y = -3 + 6*rand(50,1);
v = sin(x).^4 .* cos(y);

创建一个查询点网格。

[xq,yq] = meshgrid(-3:0.1:3);

使用 "nearest""linear""natural""cubic" 方法进行样本数据插值。绘制结果进行比较。

z1 = griddata(x,y,v,xq,yq,"nearest");
plot3(x,y,v,"mo")
hold on
mesh(xq,yq,z1)
title("Nearest Neighbor")
legend("Sample Points","Interpolated Surface","Location","NorthWest")

Figure contains an axes object. The axes object with title Nearest Neighbor contains 2 objects of type line, surface. One or more of the lines displays its values using only markers These objects represent Sample Points, Interpolated Surface.

z2 = griddata(x,y,v,xq,yq,"linear");
figure
plot3(x,y,v,"mo")
hold on
mesh(xq,yq,z2)
title("Linear")
legend("Sample Points","Interpolated Surface","Location","NorthWest")

Figure contains an axes object. The axes object with title Linear contains 2 objects of type line, surface. One or more of the lines displays its values using only markers These objects represent Sample Points, Interpolated Surface.

z3 = griddata(x,y,v,xq,yq,"natural");
figure
plot3(x,y,v,"mo")
hold on
mesh(xq,yq,z3)
title("Natural Neighbor")
legend("Sample Points","Interpolated Surface","Location","NorthWest")

Figure contains an axes object. The axes object with title Natural Neighbor contains 2 objects of type line, surface. One or more of the lines displays its values using only markers These objects represent Sample Points, Interpolated Surface.

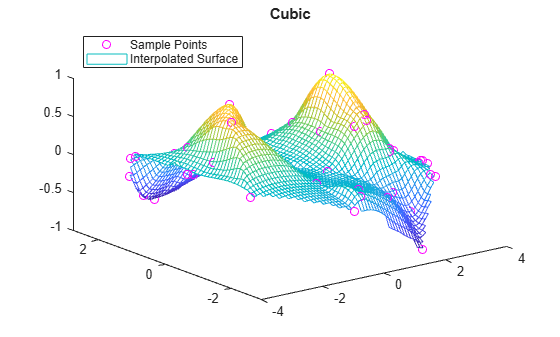
z4 = griddata(x,y,v,xq,yq,"cubic");
figure
plot3(x,y,v,"mo")
hold on
mesh(xq,yq,z4)
title("Cubic")
legend("Sample Points","Interpolated Surface","Location","NorthWest")
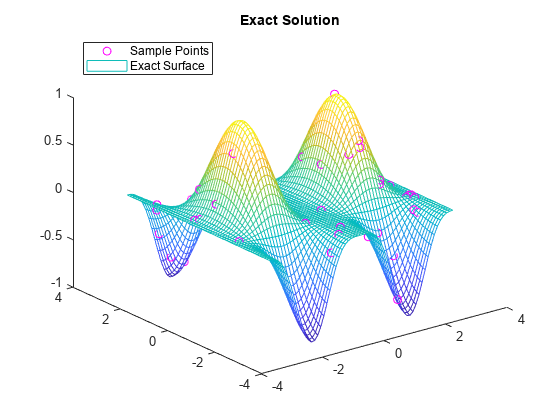
Figure contains an axes object. The axes object with title Cubic contains 2 objects of type line, surface. One or more of the lines displays its values using only markers These objects represent Sample Points, Interpolated Surface.

绘制精确解。

figure
plot3(x,y,v,"mo")
hold on
mesh(xq,yq,sin(xq).^4 .* cos(yq))
title("Exact Solution")
legend("Sample Points","Exact Surface","Location","NorthWest")

Figure contains an axes object. The axes object with title Exact Solution contains 2 objects of type line, surface. One or more of the lines displays its values using only markers These objects represent Sample Points, Exact Surface.

输入参数

全部折叠

样本点坐标,指定为向量。xyz 中的相应元素指定已知样本值 v 的点的 xyz 坐标。样本点必须唯一。

数据类型: double

样本值,指定为向量。v 中的样本值对应于 xyz 中的样本点。

如果 v 包含复数,则 griddata 将分别对实部和虚部插值。

数据类型: double
复数支持:

查询点,指定为向量或数组。向量或数组中的对应元素指定查询点的 xyz 坐标。查询点是 griddata 执行插值的位置。

  • 如果要传递查询点网格,请指定数组。使用 ndgridmeshgrid 构造数组。

  • 如果要传递散点集合,请指定向量。

指定的查询点必须位于样本数据点的凸包内。对于凸包外的查询点,griddata 将返回 NaN

数据类型: double

插值方法,指定为下表中的方法之一。

方法描述连续性
"linear"基于三角剖分的线性插值(默认),支持二维和三维插值。C0
"nearest"基于三角剖分的最近邻点插值,支持二维和三维插值。不连续
"natural"基于三角剖分的自然邻点插值,支持二维和三维插值。该方法在线性与立方之间达到有效的平衡。C1,样本点处除外
"cubic"基于三角剖分的三次插值,仅支持二维插值。C2
"v4"

双调和样条插值(MATLAB® 4 griddata 方法)仅支持二维插值。和其他方法不同,该插值不是基于三角剖分。

C2

数据类型: char | string

输出参数

全部折叠

插入的值,以向量或数组形式返回。vq 的大小取决于查询点输入 xqyqzq 的大小:

  • 对于二维插值(其中 xqyq 指定查询点的 m×n 网格),vqm×n 数组。

  • 对于三维插值(其中 xqyqzq 指定查询点的 m×n×p 网格),vqm×n×p 数组。

  • 如果 xqyq(对于三维插值还有 zq)是指定散点的向量,则 vq 是长度相同的向量。

对于除 "v4" 以外的所有插值方法,输出 vq 为位于样本数据凸包之外的查询点包含 NaN 值。"v4" 方法为所有点执行相同的计算,而不管这些点的位置在哪里。

查询点的网格坐标,以向量或矩阵形式返回。XqYq 的形状取决于您如何指定 xqyq

  • 如果将 xq 指定为行向量,将 yq 指定为列向量,则 griddata 使用这些网格向量通过 [Xq,Yq] = meshgrid(xq,yq) 来构成完整网格。在这种情况下,XqYq 输出以包含查询点的完整网格坐标的矩阵形式返回。

  • 如果 xqyq 均为行向量或均为列向量,则 Xq = xqYq = yq

提示

  • 使用 griddata 进行的散点数据插值基于数据的 Delaunay 三角剖分,因此对 xyz 的缩放问题非常敏感。出现这种情况时,您可以使用 normalize 重新缩放数据并改进结果。有关详细信息,请参阅对不同量级的数据进行归一化

扩展功能

版本历史记录

在 R2006a 之前推出