poseGraph
Create 2-D pose graph
Description
A poseGraph object stores information for a 2-D pose graph
representation. A pose graph contains nodes connected by edges. Each node estimate is
connected to the graph by edge constraints that define the relative pose between nodes
and the uncertainty on that measurement.
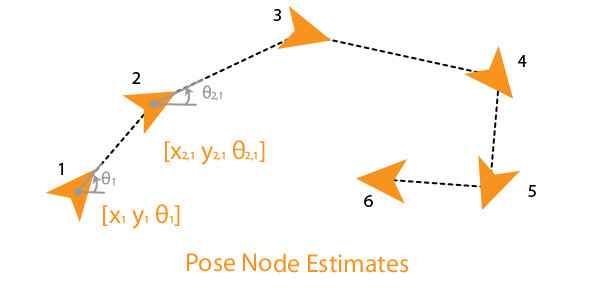
To construct a pose graph iteratively, use the addRelativePose function to add relative pose estimates and connect them
to an existing node with specified edge constraints. Pose nodes must be specified
relative to a pose node. Specify the uncertainty of the measurement using an information
matrix.
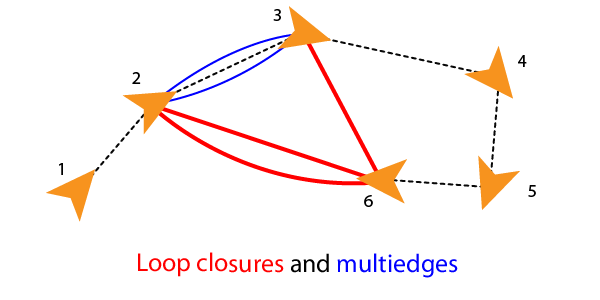
Adding an edge between two nonsequential nodes creates a loop
closure in the graph. Multiple edges or multiedges
between node pairs are also supported, which includes loop closures. To add additional
edge constraints or loop closures, specify the node IDs using the addRelativePose function. When optimizing the pose graph, the optimizePoseGraph function finds a solution to satisfy all these edge
constraints.
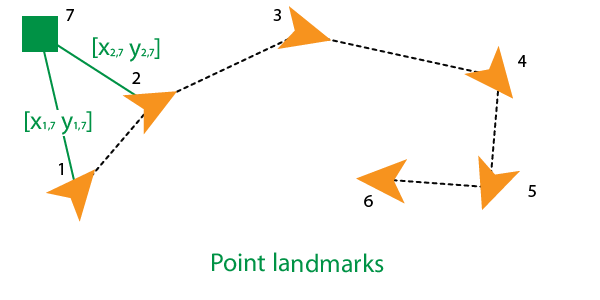
To add landmark point nodes, use the addPointLandmark function. This function specifies nodes as
xy-points without orientation estimates. Landmarks must be
specified relative to a pose node.
The lidarSLAM
object performs lidar-based simultaneous localization and mapping, which is based around
the optimization of a 2-D pose graph.
For 3-D pose graphs, see the poseGraph3D
object or the Landmark SLAM Using AprilTag Markers example.
Creation
Description
poseGraph = poseGraph creates a 2-D pose graph object.
Add poses using addRelativePose to construct a pose graph
iteratively.
poseGraph = poseGraph('MaxNumEdges',maxEdges,'MaxNumNodes',maxNodes)
specifies an upper bound on the number of edges and nodes allowed in the
pose graph when generating code. This syntax is only required when
generating code.
Properties
Object Functions
addPointLandmark | Add landmark point node to pose graph |
addRelativePose | Add relative pose to pose graph |
copy | Create copy of pose graph |
edgeNodePairs | Edge node pairs in pose graph |
edgeConstraints | Edge constraints in pose graph |
edgeResidualErrors | Compute pose graph edge residual errors |
findEdgeID | Find edge ID of edge |
nodeEstimates | Poses of nodes in pose graph |
removeEdges | Remove loop closure edges from graph |
show | Plot pose graph |
Examples
Optimize a pose graph based on the nodes and edge constraints. The pose graph used in this example is from the Intel Research Lab Dataset and was generated from collecting wheel odometry and a laser range finder sensor information in an indoor lab.
Load the Intel® data set that contains a 2-D pose graph. Inspect the poseGraph object to view the number of nodes and loop closures.
load intel-2d-posegraph.mat pg
disp(pg)
  poseGraph with properties:

               NumNodes: 1228
               NumEdges: 1483
    NumLoopClosureEdges: 256
     LoopClosureEdgeIDs: [1228 1229 1230 1231 1232 1233 1234 1235 1236 1237 1238 1239 1240 1241 1242 1243 1244 1245 1246 1247 1248 1249 1250 1251 1252 1253 1254 1255 1256 1257 1258 1259 1260 1261 1262 1263 1264 1265 1266 1267 1268 1269 … ] (1×256 double)
        LandmarkNodeIDs: [1×0 double]
Plot the pose graph with IDs off. Red lines indicate loop closures identified in the dataset.
show(pg,'IDs','off');
title('Original Pose Graph')
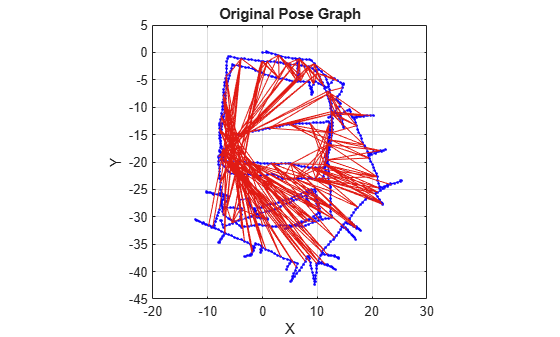
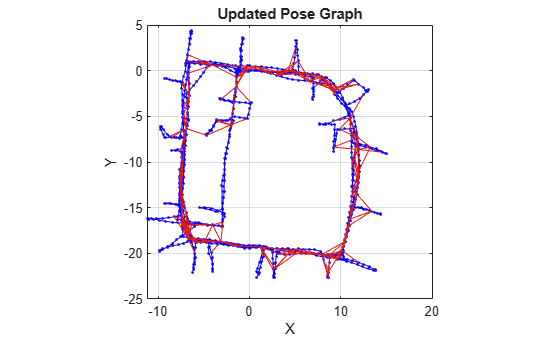
Optimize the pose graph. Nodes are adjusted based on the edge constraints and loop closures. Plot the optimized pose graph to see the adjustment of the nodes with loop closures.
updatedPG = optimizePoseGraph(pg);
figure
show(updatedPG,'IDs','off');
title('Updated Pose Graph')
References
[1] Grisetti, G., R. Kummerle, C. Stachniss, and W. Burgard. "A Tutorial on Graph-Based SLAM." IEEE Intelligent Transportation Systems Magazine. Vol. 2, No. 4, 2010, pp. 31–43. doi:10.1109/mits.2010.939925.
Extended Capabilities
Version History
Introduced in R2019b