主要内容

resample

将均匀或非均匀数据重采样到新固定速率

说明

y = resample(x,p,q) 以原始采样率的 p/q 倍对输入序列 x 进行重采样。resamplex 应用 FIR 抗混叠低通滤波器并补偿滤波器引入的延迟。该函数沿大于 1 的第一个数组维度进行运算。

示例

y = resample(x,p,q,n) 使用阶数为 2 × n × max(p,q) 的抗混叠滤波器。

y = resample(x,p,q,n,beta) 指定用于设计低通滤波器的凯塞窗的形状参数。

示例

y = resample(x,p,q,b) 使用在 b 中指定的滤波器系数对 x 进行滤波。

yTT = resample(xTT,p,q,___) 以原始采样率的 p/q 倍对 MATLAB® 时间表 xTT 中的均匀采样数据进行重采样,并返回时间表 yTT。您可以指定其他参量 nbetab

示例

y = resample(x,tx) 对在向量 tx 中指定的时刻采样的信号值 x 进行重采样。该函数将 x 线性插值到具有与 tx 相同的端点和采样数的均匀间隔时刻向量上。NaN 被视为缺失数据并被忽略。

y = resample(x,tx,fs) 使用多相抗混叠滤波器以在 fs 中指定的均匀采样率对信号进行重采样。

y = resample(x,tx,fs,p,q) 将输入信号插值到一个中间均匀网格上,采样间距为 (p/q)/fs。然后,该函数对结果进行滤波,以按 p 对其进行上采样并按 q 进行下采样,生成的最终采样率为 fs。为了获得最佳结果,请确保 fs × q/p 至少是 x 的最高频率分量的两倍。

y = resample(x,tx,___,method) 指定插值方法以及此组中上述语法使用的任何参量。插值方法可以是 "linear""pchip""spline"

示例

[y,ty] = resample(x,tx,___)ty 中返回与重采样的信号对应的时刻。

yTT = resample(xTT,___)xTT 中的非均匀采样数据进行重采样并返回均匀采样数据。yTT 具有与 xTT 相同的端点和采样数。您可以指定与输入 x,tx 可用的参量相同的参量选项。

示例

[y,b] = resample(x,p,q,___) 还返回在重采样期间应用于 x 的滤波器系数。

示例

[y,ty,b] = resample(x,tx,___)b 中返回抗混叠滤波器的系数。

[yTT,b] = resample(xTT,___)xTT 中的时间表数据进行重采样,并在 b 中返回抗混叠滤波器的系数。

[___] = resample(___,Dimension=dim) 沿维度 dim 对输入进行重采样。

示例

示例

全部折叠

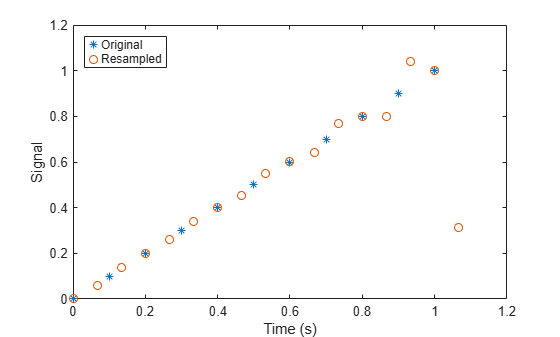
以原始速率 10 Hz 的 3/2 倍对一个简单线性序列进行重采样。在同一图窗上绘制原始信号和重采样信号。

fs = 10;
t1 = 0:1/fs:1;
x = t1;
y = resample(x,3,2);
t2 = (0:(length(y)-1))*2/(3*fs);

plot(t1,x,'*',t2,y,'o')
xlabel('Time (s)')
ylabel('Signal')
legend('Original','Resampled', ...
    'Location','NorthWest')

Figure contains an axes object. The axes object with xlabel Time (s), ylabel Signal contains 2 objects of type line. One or more of the lines displays its values using only markers These objects represent Original, Resampled.

在滤波时,resample 假设输入序列 x 在为其提供的采样之前和之后为零。如果 x 的端点处与零的偏差较大,则可能导致 y 出现意外值。

通过对三角序列和该序列具有非零端点的垂直移位版本进行重采样来显示这些偏差。

x = [1:10 9:-1:1;
    10:-1:1 2:10]';
y = resample(x,3,2);

subplot(2,1,1)
plot(1:19,x(:,1),'*',(0:28)*2/3 + 1,y(:,1),'o')
title('Edge Effects Not Noticeable')
legend('Original','Resampled', ...
    'Location','South')

subplot(2,1,2)
plot(1:19,x(:,2),'*',(0:28)*2/3 + 1,y(:,2),'o')
title('Edge Effects Noticeable')
legend('Original','Resampled', ...
    'Location','North')

Figure contains 2 axes objects. Axes object 1 with title Edge Effects Not Noticeable contains 2 objects of type line. One or more of the lines displays its values using only markers These objects represent Original, Resampled. Axes object 2 with title Edge Effects Noticeable contains 2 objects of type line. One or more of the lines displays its values using only markers These objects represent Original, Resampled.

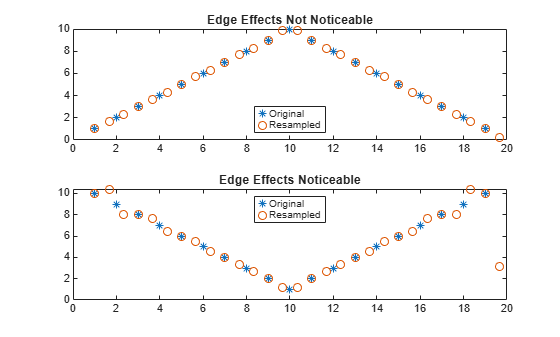
构造一个正弦信号。指定采样率,使得 16 个采样恰好对应一个信号周期。绘制信号的针状图。叠加采样保持可视化的阶梯图。

fs = 16;
t = 0:1/fs:1-1/fs;

x = 0.75*sin(2*pi*t);

stem(t,x)
hold on
stairs(t,x)
hold off

Figure contains an axes object. The axes object contains 2 objects of type stem, stair.

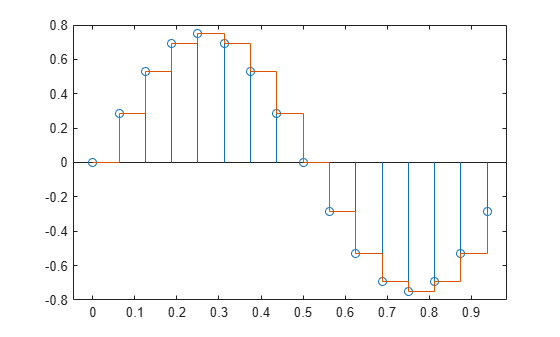
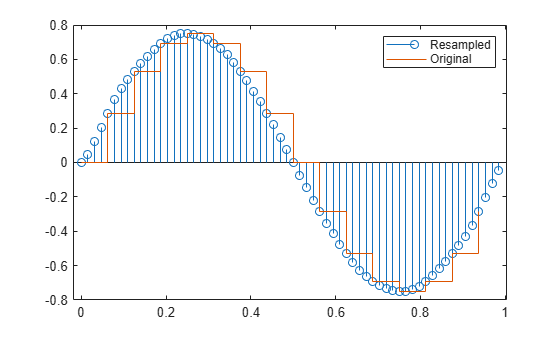
使用 resample 按因子 4 对信号进行上采样。使用默认设置。将结果与原始信号一起绘制。

ups = 4;
dns = 1;

fu = fs*ups;
tu = 0:1/fu:1-1/fu;

y = resample(x,ups,dns);

stem(tu,y)
hold on
stairs(t,x)
hold off
legend("Resampled","Original")

Figure contains an axes object. The axes object contains 2 objects of type stem, stair. These objects represent Resampled, Original.

重复该计算。指定 n = 1,以使抗混叠滤波器的阶数为 2×1×4=8。指定凯塞窗的形状参数 β=0。输出滤波器以及重采样的信号。

n = 1;
beta = 0;

[y,b] = resample(x,ups,dns,n,beta);

fo = filtord(b)
fo = 
8
stem(tu,y)
hold on
stairs(t,x,"--")
hold off
legend("n = 1, \beta = 0")

Figure contains an axes object. The axes object contains 2 objects of type stem, stair. This object represents n = 1, \beta = 0.

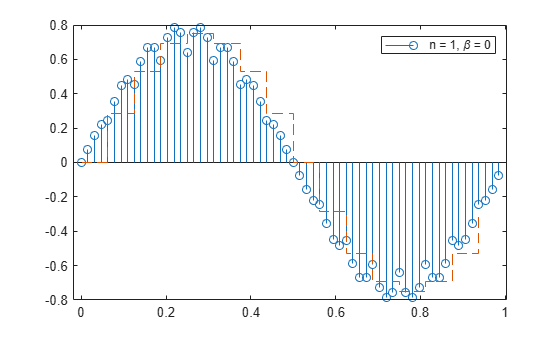
重采样的信号显示由于窗的主瓣相对较宽和旁瓣衰减较低而导致的混叠效应。

n 增大到 5 并保留 β=0。验证滤波器的阶数为 40。绘制重采样的信号。

n = 5;

[y,b] = resample(x,ups,dns,n,beta);

fo = filtord(b)
fo = 
40
stem(tu,y)
hold on
stairs(t,x,"--")
hold off
legend("n = 5, \beta = 0")

Figure contains an axes object. The axes object contains 2 objects of type stem, stair. This object represents n = 5, \beta = 0.

窗越长,主瓣越窄,混叠效应的衰减越好。它还会衰减信号。

将滤波器阶数保留为 2×5×4=40,并将形状参数增大到 β=20

beta = 20;

y = resample(x,ups,dns,n,beta);

stem(tu,y)
hold on
stairs(t,x,"--")
hold off
legend("n = 5, \beta = 20")
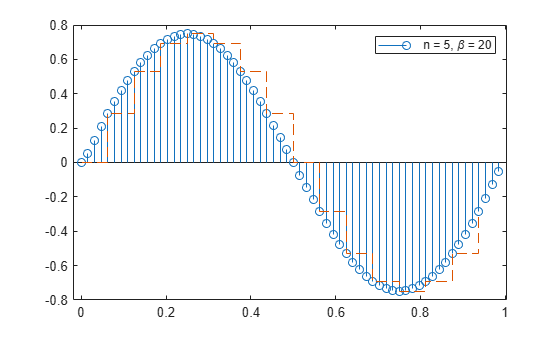
Figure contains an axes object. The axes object contains 2 objects of type stem, stair. This object represents n = 5, \beta = 20.

高旁瓣衰减会带来良好的重采样。

减小滤波器阶数使其回到 2×1×4=8 并保留 β=20

n = 1;

[y,b] = resample(x,ups,dns,n,beta);

stem(tu,y)
hold on
stairs(t,x,"--")
hold off
legend("n = 1, \beta = 20")
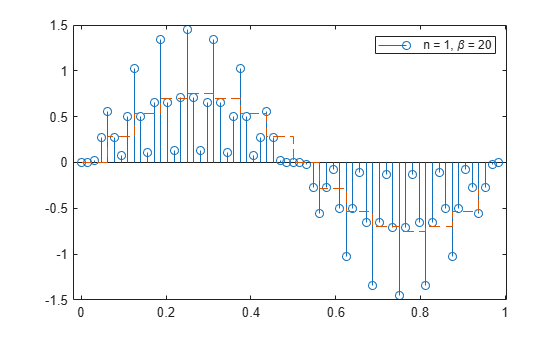
Figure contains an axes object. The axes object contains 2 objects of type stem, stair. This object represents n = 1, \beta = 20.

较宽的主瓣在重采样时会生成大量伪影。

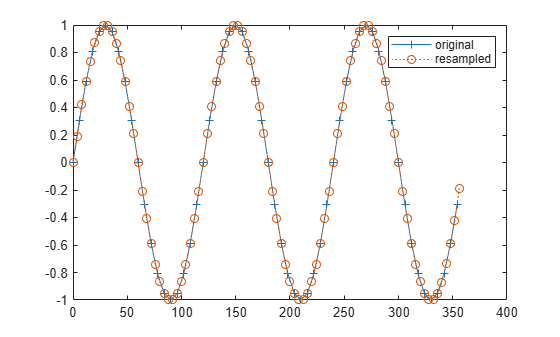
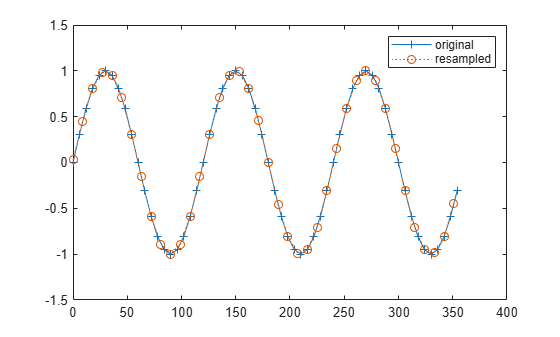
生成一个正弦波的 60 个采样,并以原始速率的 3/2 倍对其进行重采样。显示原始信号和重采样的信号。

tx = 0:6:360-3;
x = sin(2*pi*tx/120);

ty = 0:4:360-2;
[y,by] = resample(x,3,2);

plot(tx,x,'+-',ty,y,'o:')
legend('original','resampled')
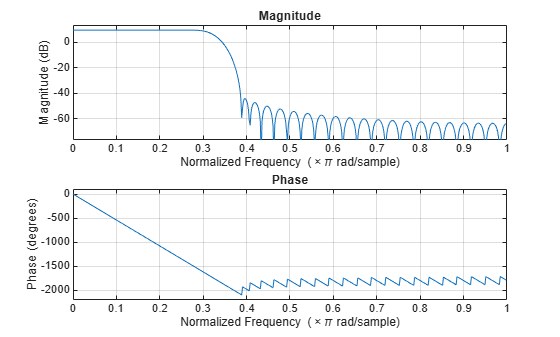
Figure contains an axes object. The axes object contains 2 objects of type line. These objects represent original, resampled.

绘制抗混叠滤波器的频率响应。

freqz(by)

Figure contains 2 axes objects. Axes object 1 with title Phase, xlabel Normalized Frequency (\times\pi rad/sample), ylabel Phase (degrees) contains an object of type line. Axes object 2 with title Magnitude, xlabel Normalized Frequency (\times\pi rad/sample), ylabel Magnitude (dB) contains an object of type line.

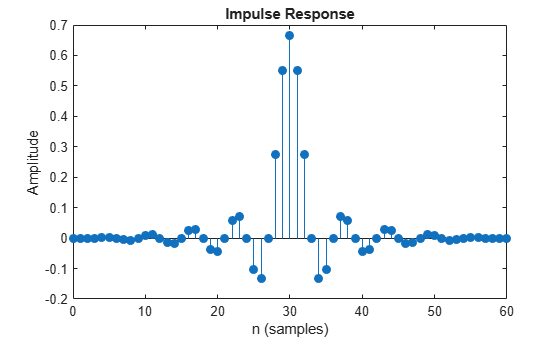
以原始速率的 2/3 倍对信号进行重采样。显示原始信号及其重采样。

tz = 0:9:360-9;
[z,bz] = resample(x,2,3);

plot(tx,x,'+-',tz,z,'o:')
legend('original','resampled')

Figure contains an axes object. The axes object contains 2 objects of type line. These objects represent original, resampled.

绘制新的低通滤波器的冲激响应。

impz(bz)

Figure contains an axes object. The axes object with title Impulse Response, xlabel n (samples), ylabel Amplitude contains an object of type stem.

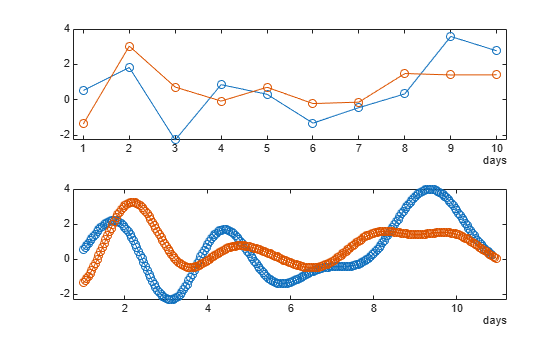
创建两个由十个随机生成的数字组成的向量。假设每个向量中的一个数字每天记录一次,总共记录十天。将数据存储在一个 MATLAB 时间表中。

a = randn(10,1);
b = randn(10,1);

t = days(1:10);

xTT = timetable(t',[a b]);

使用 resample 函数将采样率从每天一次增大到每小时一次。绘制这两个数据集。

yTT = resample(xTT,24,1);

subplot(2,1,1)
plot(xTT.Time,xTT.Var1,'-o')
subplot(2,1,2)
plot(yTT.Time,yTT.Var1,'-o')

Figure contains 2 axes objects. Axes object 1 contains 2 objects of type line. Axes object 2 contains 2 objects of type line.

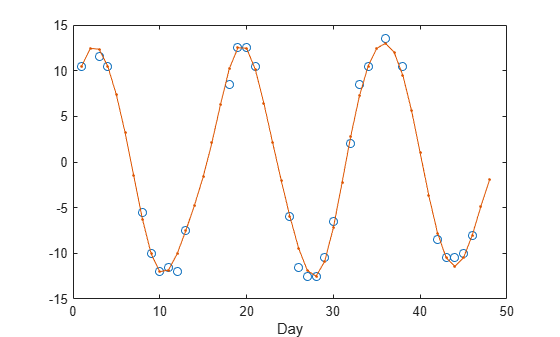
使用伽利略·伽利莱在 1610 年记录的数据来确定木星四颗最大卫星中最外层的卡利斯托卫星的环移周期。

伽利略对卫星运动的观测持续了六周,从 1 月 15 日开始。由于在多云的夜晚无法观测木星,观测数据中有几处空白。生成观测时间的 datetime 数组。

t = [0 2 3 7 8 9 10 11 12 17 18 19 20 24 25 26 27 28 29 31 32 33 35 37 ...
    41 42 43 44 45]'+1;

yg = [10.5 11.5 10.5 -5.5 -10.0 -12.0 -11.5 -12.0 -7.5 8.5 12.5 12.5 ...
    10.5 -6.0 -11.5 -12.5 -12.5 -10.5 -6.5 2.0 8.5 10.5 13.5 10.5 -8.5 ...
    -10.5 -10.5 -10.0 -8.0]';

obsv = datetime(1610,1,15+t);

使用每天进行一次观测的采样率将数据重采样到规则网格上。使用适度的上采样因子 3 以避免过拟合。

fs = 1;

[y,ty] = resample(yg,t,fs,3,1);

绘制数据和重采样的信号。

plot(t,yg,'o',ty,y,'.-')
xlabel('Day')

Figure contains an axes object. The axes object with xlabel Day contains 2 objects of type line. One or more of the lines displays its values using only markers

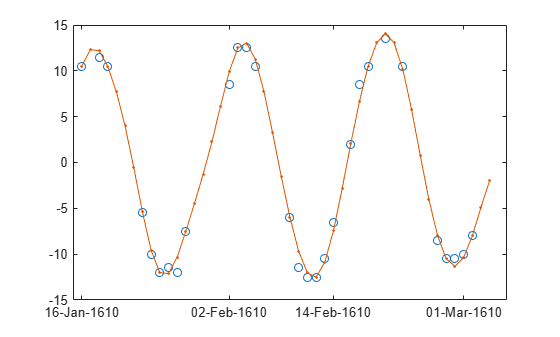
重复该过程,使用样条插值并显示观测日期。以每天的倒数为单位来表示采样率。

fs = 1/86400;

[ys,tys] = resample(yg,obsv,fs,3,1,'spline');

plot(t,yg,'o')
hold on
plot(ys,'.-')
hold off

ax = gca;
ax.XTick = t(1:9:end);
ax.XTickLabel = char(obsv(1:9:end));

Figure contains an axes object. The axes object contains 2 objects of type line. One or more of the lines displays its values using only markers

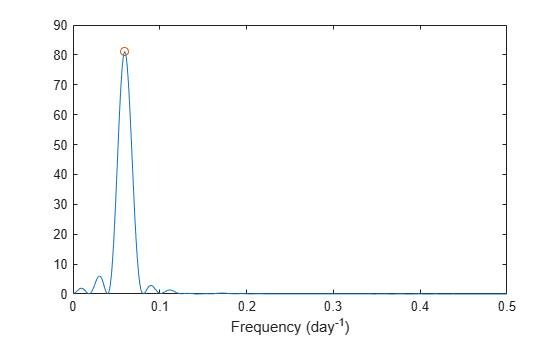
计算均匀间隔的线性插值数据的周期图功率谱估计值。选择 1024 作为 DFT 长度。信号在轨道周期的倒数处达到峰值。

[pxx,f] = periodogram(ys,[],1024,1,'power');
[pk,i0] = max(pxx);

f0 = f(i0);
T0 = 1/f0
T0 = 
16.7869
plot(f,pxx,f0,pk,'o')
xlabel('Frequency (day^{-1})')

Figure contains an axes object. The axes object with xlabel Frequency (day toThePowerOf - 1 baseline ) contains 2 objects of type line. One or more of the lines displays its values using only markers

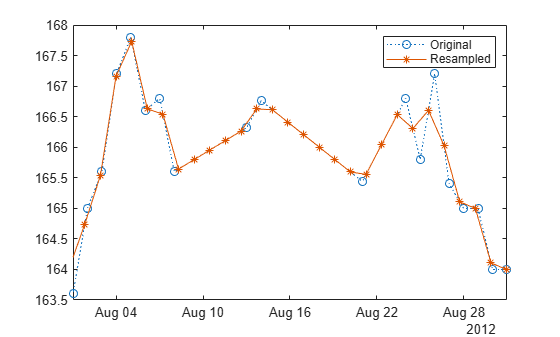
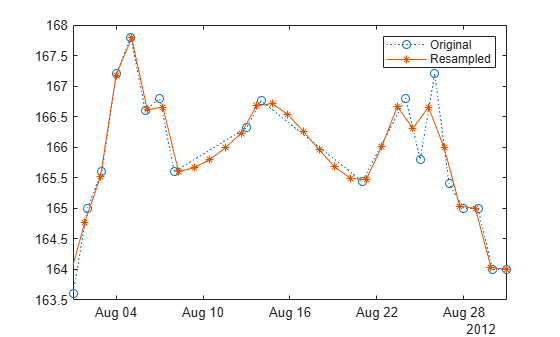
某人在 2012 年(闰年)的大部分日子里记录了自己的体重(以磅为单位)。他将缺失的采样输入为 NaN。加载数据并将测量值存储在一个 MATLAB 时间表中。使用 datetime 向量指定行时间并删除缺失的采样。

load weight2012.dat

rowTimes = datetime(2012,1,1:366)';
wt = weight2012(:,2);
xTT = timetable(rowTimes,wt);
xTT(isnan(wt),:) = [];

对数据进行重采样。得到一个时间表,其中包含与 wt 具有相同端点和采样数的均匀采样数据。

yTT = resample(xTT);

绘制原始数据和重采样的数据以进行比较。调整 x 轴范围以仅显示 8 月份的测量值。

plot(xTT.rowTimes,xTT.wt,":o",yTT.Time,yTT.wt,"-*")
aug = datetime([2012 08 01;2012 08 31]); 
xlim(aug)
legend(["Original" "Resampled"])
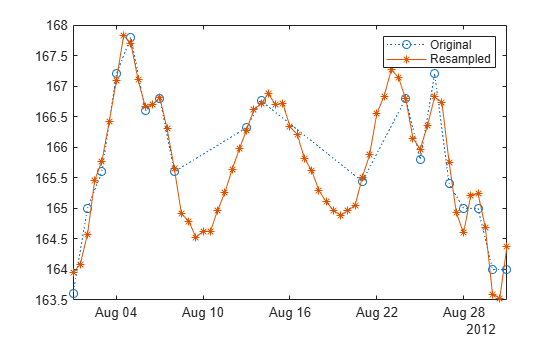
Figure contains an axes object. The axes object contains 2 objects of type line. These objects represent Original, Resampled.

使用三次插值再次对数据进行重采样。

yTTs = resample(xTT,"pchip");

plot(xTT.rowTimes,xTT.wt,":o",yTTs.Time,yTTs.wt,"-*")
xlim(aug)
legend(["Original" "Resampled"])

Figure contains an axes object. The axes object contains 2 objects of type line. These objects represent Original, Resampled.

现在将采样率提高到每天两次测量,并使用样条插值。绘制结果。

fs = 1/86400;
yTTf = resample(xTT,2*fs,"spline");

plot(xTT.rowTimes,xTT.wt,":o",yTTf.Time,yTTf.wt,'-*')
xlim(aug)
legend(["Original" "Resampled"])

Figure contains an axes object. The axes object contains 2 objects of type line. These objects represent Original, Resampled.

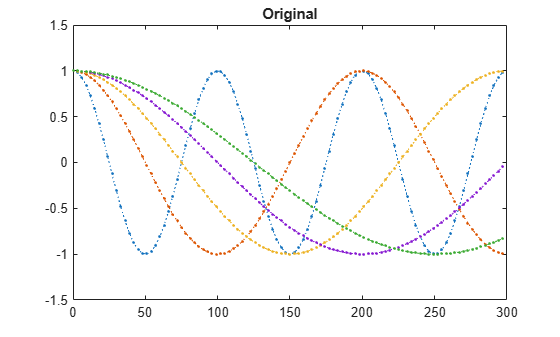
生成一个包含 100 个采样的五通道正弦信号。时间按列从左到右递增,频率按行从上到下递增。绘制信号。

p = 3;
q = 2;

tx = 0:p:300-p;

x = cos(2*pi*tx./(1:5)'/100);

plot(tx,x,'.:')
title('Original')
ylim([-1.5 1.5])

Figure contains an axes object. The axes object with title Original contains 5 objects of type line.

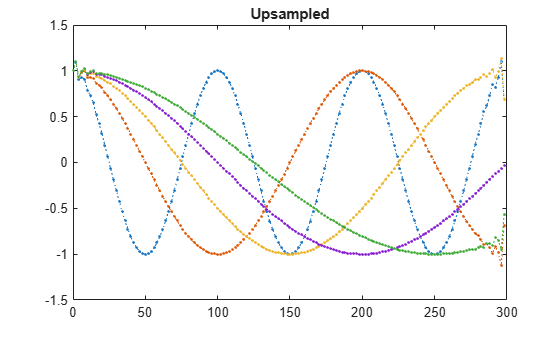
沿其第二个维度按 3/2 因子对正弦信号进行上采样。在图上叠加重采样的信号。

ty = 0:q:300-q;

y = resample(x,p,q,'Dimension',2);

plot(ty,y,'.:')
title('Upsampled')

Figure contains an axes object. The axes object with title Upsampled contains 5 objects of type line.

将重采样的信号重构为时间沿第三个维度的形式。

y = permute(y,[1 3 2]);
size(y)
ans = 1×3

     5     1   150

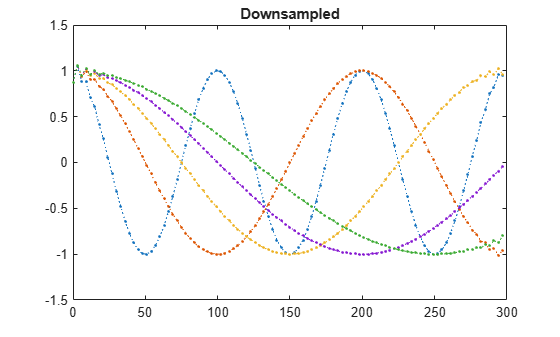
对信号进行下采样,使其回到原始速率并对其绘图。

z = resample(y,q,p,'Dimension',3);

plot(tx,squeeze(z),'.:')
title('Downsampled')

Figure contains an axes object. The axes object with title Downsampled contains 5 objects of type line.

输入参数

全部折叠

输入信号,指定为向量、矩阵或 N 维数组。当提供了时间信息时,x 可能会包含 NaNNaN 被视为缺失数据并排除在重采样之外。

示例: cos(pi/4*(0:159))+randn(1,160) 是单通道行向量信号。

示例: cos(pi./[4;2]*(0:159))'+randn(160,2) 是双通道信号。

数据类型: single | double

重采样因子,指定为正整数。

数据类型: single | double

邻点项数,指定为非负整数。如果 n = 0,则 resample 执行最近邻点插值。抗混叠 FIR 滤波器的长度与 n 成正比。较大的 n 值以更多计算时间为代价提供更好的准确性。

数据类型: single | double

凯塞窗的形状参数,指定为正实数标量。增大 beta 会加宽用于设计抗混叠滤波器的窗的主瓣并减小窗的旁瓣振幅。

数据类型: single | double

FIR 滤波器系数,指定为向量。默认情况下,resample 使用 firls 和凯塞窗设计滤波器。在补偿延迟时,resample 假设 b 具有奇数长度和线性相位。有关详细信息,请参阅抗混叠低通滤波器

数据类型: single | double

至少包含两行的输入时间表,指定为 timetablexTT 中的每个变量被视为一个独立信号。如果时间表中的变量是一个 N 维数组,则 resample 沿第一个维度进行运算。

注意

  • RowTimes 必须为持续时间向量或具有唯一且有限值的 datetime 对象。非有限时间值被视为缺失数据并被忽略。

  • 如果未排序,则 resample 按升序对 RowTimes 进行排序。

有关详细信息,请参阅timetable

时刻,指定为非负实数向量或 datetime 数组。tx 必须单调递增,但不必均匀间隔。tx 可以包含 NaNNaT。这些值被视为缺失数据并排除在重采样之外。tx 仅对输入 x 有效。

数据类型: single | double | datetime

采样率,指定为正标量。采样率是单位时间内的采样数。如果时间单位是秒,则采样率的单位是赫兹。

数据类型: single | double

插值方法,指定为 "linear""pchip""spline" 之一:

  • "linear" - 线性插值。

  • "pchip" - 保形分段三次插值。

  • "spline" - 使用非节点终止条件的样条插值。

有关详细信息,请参阅 interp1 参考页。

注意

如果 x 并非缓慢变化,请考虑使用 interp1"pchip" 插值方法。

沿其运算的维度,指定为正整数标量。如果未指定 dim,则 resample 沿大于 1 的第一个数组维度进行运算。如果输入是时间表,则 dim 必须为 1。

数据类型: single | double

输出参量

全部折叠

重采样的信号,以向量、矩阵或 N 维数组形式返回。如果 x 沿维度 dim 的长度为 N,并且您指定了 pq,则 y 沿 dim 的长度为 N × p/q

FIR 滤波器系数,以向量形式返回。

输出时刻,以非负实数向量形式返回。ty 仅适用于输入 x

重采样的时间表,以 timetable 形式返回。

详细信息

全部折叠

提示

  • 使用 isregular 函数确定时间表是否为均匀采样。

算法

resample 使用 firls 执行 FIR 设计,对结果进行归一化以考虑窗的处理增益,然后使用 upfirdn 实现速率变更。

扩展功能

全部展开

版本历史记录

在 R2006a 之前推出

全部展开