脉冲和跃迁特征的测量
此示例说明如何分析脉冲和跃迁,以及如何计算上升时间、下降时间、压摆率、过冲、下冲、脉冲宽度、占空比和脉冲周期等度量。
含噪时钟信号
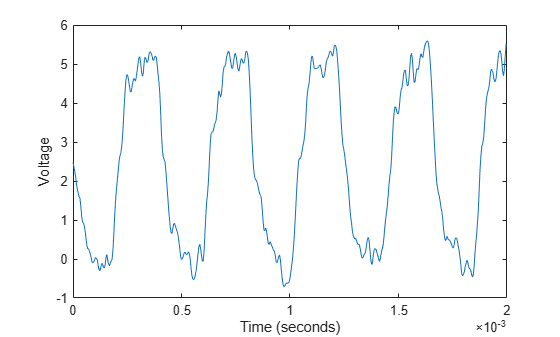
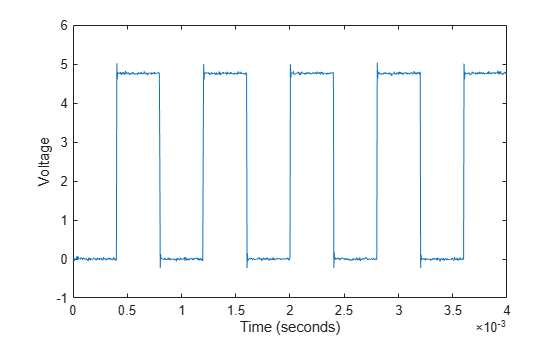
首先查看来自含噪时钟信号的采样。
load clocksig clock1 time1 Fs

plot(time1,clock1)
xlabel('Time (seconds)')
ylabel('Voltage')
估计状态电平
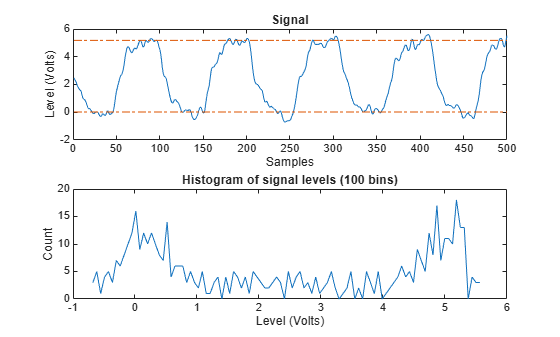
不带输出参量调用 statelevels 来可视化状态电平。直方图方法用于通过以下步骤估计状态电平:
确定数据的最小和最大振幅。
对于指定数量的直方图 bin,确定 bin 宽度,即振幅范围与 bin 数量之比。使用可选输入参量指定直方图 bin 的数量和直方图边界。
将数据值划分到直方图 bin 中。
标识具有非零计数的最低和最高索引直方图 bin。
将直方图分成两个子直方图。
通过确定上直方图和下直方图的众数或均值来计算状态电平。
statelevels(clock1)
ans = 1×2

    0.0138    5.1848
计算的直方图在第一个和最后一个 bin 之间分成两个大小相等的区域。直方图的每个区域的模式在命令行窗口中以估计的状态电平值形式返回。
测量上升时间、下降时间和压摆率
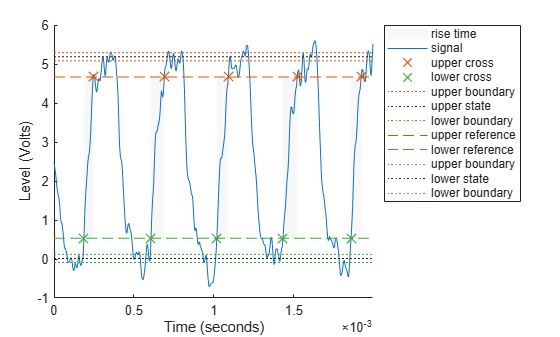
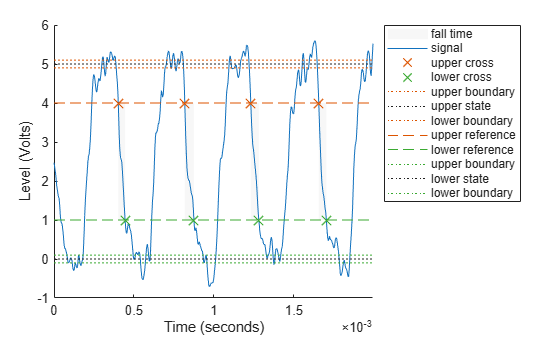
上升时间是每个脉冲的上升过渡从穿过下参考电平到穿过上参考电平的两个时刻之间的持续时间。下降时间是每个脉冲的下降过渡从穿过上参考电平到穿过下参考电平的两个时刻之间的持续时间。用来计算上升时间和下降时间的默认参考电平设置为波形振幅的 10% 和 90%。
不带输出参量调用 risetime 来可视化正向边沿的上升时间。然后,不带输出参量调用 falltime 来可视化负向边沿的下降时间。将参考电平指定为 [20 80],将状态电平指定为 [0 5]。
risetime(clock1,time1)
ans = 5×1
10-4 ×

    0.5919
    0.8344
    0.7185
    0.8970
    0.6366
falltime(clock1,time1,'PercentReferenceLevels',[20 80],'StateLevels',[0 5])
ans = 4×1
10-4 ×

    0.4294
    0.5727
    0.5032
    0.4762
带一个或多个输出参量调用函数,以编程方式获取测量值。对于均匀采样的数据,您可以提供采样率来代替时间向量。使用 slewrate 测量每个正向或负向边沿的斜率。
sr = slewrate(clock1(1:100),Fs)
sr =
7.0840e+04
分析过冲和下冲
现在查看来自时钟的具有明显过冲和下冲的数据。
load clocksig clock2 time2 Fs

plot(time2,clock2)
xlabel('Time (seconds)')
ylabel('Voltage')
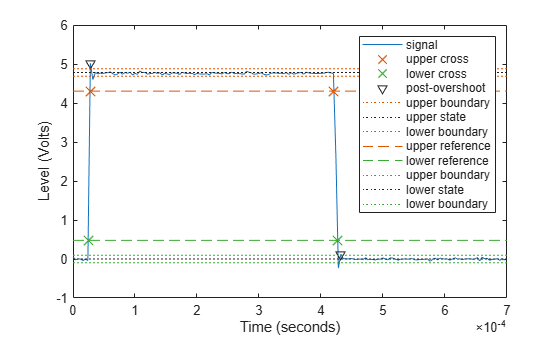
欠阻尼时钟信号有过冲。过冲表示为状态电平之间差的百分比。过冲可能发生在紧跟某个边沿后、跃迁后畸变区域的开始处。使用 overshoot 函数来测量这些后冲过冲。
overshoot(clock2(95:270),Fs)
ans = 2×1

    4.9451
    2.5399
legend('Location','NorthEast')
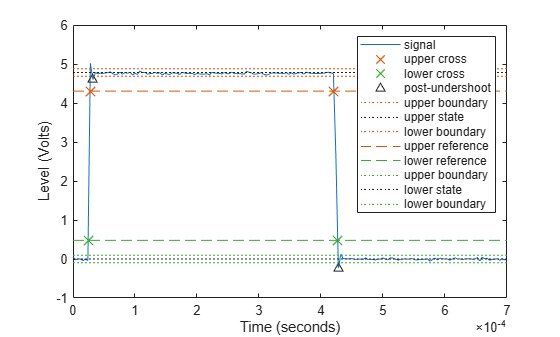
过冲也可能发生在紧挨某个边沿之前、跃迁前畸变区域的结束处。这些称为前冲过冲。
同样,您可以测量像差前和像差后区域的下冲。下冲也表示为状态电平之间差的百分比。使用可选输入参量指定测量像差的区域。
undershoot(clock2(95:270),Fs,'Region','Postshoot')
ans = 2×1

    3.8499
    4.9451
legend('Location','NorthEast')
测量脉冲宽度和占空比
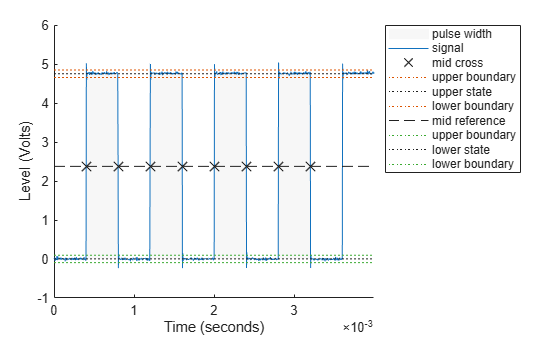
宽度是每个脉冲的第一个过渡和第二个过渡穿过中参考电平之间的持续时间。不带输出参量调用 pulsewidth 绘制突出显示的脉冲宽度。指定正极性。
pulsewidth(clock2, time2,'Polarity','Positive');
使用 dutycycle 计算每个负极性脉冲的脉冲宽度与脉冲周期的比率。
d = dutycycle(clock2,time2,'Polarity','negative')
d = 3×1

    0.4979
    0.5000
    0.5000
使用 pulseperiod 获取波形每个周期的时间长度。周期是当前脉冲的第一个过渡和下一个脉冲的第一个过渡之间的持续时间。使用此信息计算其他度量,如波形的平均频率或观测到的总抖动。
pp = pulseperiod(clock2, time2);

avgFreq = 1./mean(pp)
avgFreq =
1.2500e+03
totalJitter = std(pp)
totalJitter =
1.9866e-06
另请参阅
dutycycle | falltime | overshoot | pulseperiod | pulsewidth | risetime | slewrate | statelevels | undershoot