Main Content

linkage

Agglomerative hierarchical cluster tree

Description

Z = linkage(X) returns a matrix Z that encodes a tree containing hierarchical clusters of the rows of the input data matrix X.

Z = linkage(X,method) creates the tree using the specified method, which describes how to measure the distance between clusters. For more information, see Linkages.

example

Z = linkage(X,method,metric) performs clustering by passing metric to the pdist function, which computes the distance between the rows of X.

example

Z = linkage(X,method,metric,'savememory',value) uses a memory-saving algorithm when value is 'on', and uses the standard algorithm when value is 'off'.

example

Z = linkage(X,method,pdist_inputs) passes pdist_inputs to the pdist function, which computes the distance between the rows of X. The pdist_inputs argument consists of the 'seuclidean', 'minkowski', or 'mahalanobis' metric and an additional distance metric option.

example

Z = linkage(y) uses a vector representation y of a distance matrix. y is either computed by pdist or is a more general dissimilarity matrix conforming to the output format of pdist.

Z = linkage(y,method) creates the tree using the specified method, which describes how to measure the distance between clusters.

example

Examples

collapse all

Randomly generate sample data with 20,000 observations.

rng('default') % For reproducibility
X = rand(20000,3);

Create a hierarchical cluster tree using the ward linkage method. In this case, the 'SaveMemory' option of the clusterdata function is set to 'on' by default. In general, specify the best value for 'SaveMemory' based on the dimensions of X and the available memory.

Z = linkage(X,'ward');

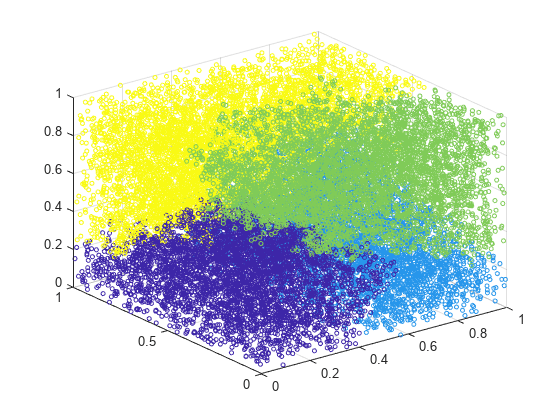
Cluster the data into a maximum of four groups and plot the result.

c = cluster(Z,'Maxclust',4);
scatter3(X(:,1),X(:,2),X(:,3),10,c)

Figure contains an axes object. The axes object contains an object of type scatter.

cluster identifies four groups in the data.

Find a maximum of three clusters in the fisheriris data set and compare cluster assignments of the flowers to their known classification.

Load the sample data.

load fisheriris

Create a hierarchical cluster tree using the 'average' method and the 'chebychev' metric.

Z = linkage(meas,'average','chebychev');

Find a maximum of three clusters in the data.

T = cluster(Z,'maxclust',3);

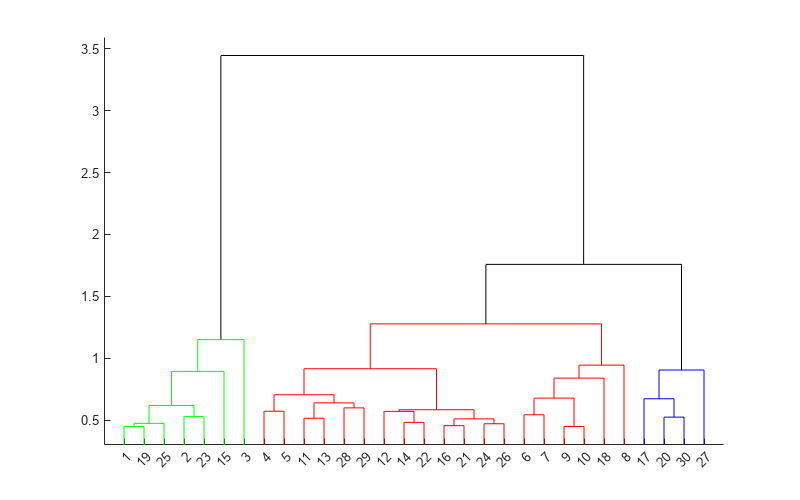
Create a dendrogram plot of Z. To see the three clusters, use 'ColorThreshold' with a cutoff halfway between the third-from-last and second-from-last linkages.

cutoff = median([Z(end-2,3) Z(end-1,3)]);
dendrogram(Z,'ColorThreshold',cutoff)

Figure contains an axes object. The axes object contains 29 objects of type line.

Display the last two rows of Z to see how the three clusters are combined into one. linkage combines the 293rd (blue) cluster with the 297th (red) cluster to form the 298th cluster with a linkage of 1.7583. linkage then combines the 296th (green) cluster with the 298th cluster.

lastTwo = Z(end-1:end,:)
lastTwo = 2×3

  293.0000  297.0000    1.7583
  296.0000  298.0000    3.4445

See how the cluster assignments correspond to the three species. For example, one of the clusters contains 50 flowers of the second species and 40 flowers of the third species.

crosstab(T,species)
ans = 3×3

     0     0    10
     0    50    40
    50     0     0

Load the examgrades data set.

load examgrades

Create a hierarchical tree using linkage. Use the 'single' method and the Minkowski metric with an exponent of 3.

Z = linkage(grades,'single',{'minkowski',3});

Observe the 25th clustering step.

Z(25,:)
ans = 1×3

   86.0000  137.0000    4.5307

linkage combines the 86th observation and the 137th cluster to form a cluster of index 120+25=145, where 120 is the total number of observations in grades and 25 is the row number in Z. The shortest distance between the 86th observation and any of the points in the 137th cluster is 4.5307.

Create an agglomerative hierarchical cluster tree using a dissimilarity matrix.

Take a dissimilarity matrix X and convert it to a vector form that linkage accepts by using squareform.

X = [0 1 2 3; 1 0 4 5; 2 4 0 6; 3 5 6 0];
y = squareform(X);

Create a cluster tree using linkage with the 'complete' method of calculating the distance between clusters. The first two columns of Z show how linkage combines clusters. The third column of Z gives the distance between clusters.

Z = linkage(y,'complete')
Z = 3×3

     1     2     1
     3     5     4
     4     6     6

Create a dendrogram plot of Z. The x-axis corresponds to the leaf nodes of the tree, and the y-axis corresponds to the linkage distances between clusters.

dendrogram(Z)

Figure contains an axes object. The axes object contains 3 objects of type line.

Input Arguments

collapse all

Input data, specified as a numeric matrix with two or more rows. The rows represent observations, and the columns represent categories or dimensions.

Data Types: single | double

Algorithm for computing the distance between clusters, specified as one of the values in this table.

MethodDescription
'average'

Unweighted average distance (UPGMA)

'centroid'

Centroid distance (UPGMC), appropriate for Euclidean distances only

'complete'

Farthest distance

'median'

Weighted center of mass distance (WPGMC), appropriate for Euclidean distances only

'single'

Shortest distance

'ward'

Inner squared distance (minimum variance algorithm), appropriate for Euclidean distances only

'weighted'

Weighted average distance (WPGMA)

For more information on these methods, see Linkages.

Distance metric, specified as any metric accepted by the pdist function. These metrics are described in the following table.

ValueDescription
'euclidean'

Euclidean distance (default)

'squaredeuclidean'

Squared Euclidean distance. (This option is provided for efficiency only. It does not satisfy the triangle inequality.)

'seuclidean'

Standardized Euclidean distance. Each coordinate difference between observations is scaled by dividing by the corresponding element of the standard deviation, S = std(X,'omitnan'). Use DistParameter to specify a different value for S.

'fasteuclidean'Euclidean distance computed by using an alternative algorithm that saves time when the number of predictors is at least 10. In some cases, this faster algorithm can reduce accuracy. Algorithms starting with 'fast' do not support sparse data. For details, see Algorithms.
'fastsquaredeuclidean'Squared Euclidean distance computed by using an alternative algorithm that saves time when the number of predictors is at least 10. In some cases, this faster algorithm can reduce accuracy. Algorithms starting with 'fast' do not support sparse data. For details, see Algorithms.
'fastseuclidean'Standardized Euclidean distance computed by using an alternative algorithm that saves time when the number of predictors is at least 10. In some cases, this faster algorithm can reduce accuracy. Algorithms starting with 'fast' do not support sparse data. For details, see Algorithms.
'mahalanobis'

Mahalanobis distance, computed using the sample covariance of X, C = cov(X,'omitrows'). Use DistParameter to specify a different value for C, where the matrix C is symmetric and positive definite.

'cityblock'

City block distance

'minkowski'

Minkowski distance. The default exponent is 2. Use DistParameter to specify a different exponent P, where P is a positive scalar value of the exponent.

'chebychev'

Chebychev distance (maximum coordinate difference)

'cosine'

One minus the cosine of the included angle between points (treated as vectors)

'correlation'

One minus the sample correlation between points (treated as sequences of values)

'hamming'

Hamming distance, which is the percentage of coordinates that differ

'jaccard'

One minus the Jaccard coefficient, which is the percentage of nonzero coordinates that differ

'spearman'

One minus the sample Spearman's rank correlation between observations (treated as sequences of values)

@distfun

Custom distance function handle. A distance function has the form

function D2 = distfun(ZI,ZJ)
% calculation of distance
...
where

  • ZI is a 1-by-n vector containing a single observation.

  • ZJ is an m2-by-n matrix containing multiple observations. distfun must accept a matrix ZJ with an arbitrary number of observations.

  • D2 is an m2-by-1 vector of distances, and D2(k) is the distance between observations ZI and ZJ(k,:).

If your data is not sparse, you can generally compute distances more quickly by using a built-in distance metric instead of a function handle.

For more information, see Distance Metrics.

Use pdist_inputs instead of metric to specify the additional input argument DistParameter of pdist for 'seuclidean', 'minkowski', or 'mahalanobis'.

Data Types: char | string | function_handle

Distance metric and distance metric option, specified as a cell array of the comma-separated pair consisting of the two input arguments Distance and DistParameter of the function pdist. This argument is valid only for specifying 'seuclidean', 'minkowski', or 'mahalanobis'.

Example: {'minkowski',5}

Data Types: cell

Flag for the 'savememory' option, specified as either 'on' or 'off'. The 'on' setting causes linkage to construct clusters without computing the distance matrix. The 'on' setting is available only when method is 'centroid', 'median', or 'ward' and metric is 'euclidean'.

When value is 'on', the linkage run time is proportional to the number of dimensions (number of columns of X). When value is 'off', the linkage memory requirement is proportional to N2, where N is the number of observations. The best (least-time) setting to use for value depends on the problem dimensions, number of observations, and available memory. The default value setting is a rough approximation of an optimal setting.

The default is 'on' when X has 20 columns or fewer, or the computer does not have enough memory to store the distance matrix. Otherwise, the default is 'off'.

Example: 'savememory','on'

Distances, specified as a numeric vector with the same format as the output of the pdist function:

  • A row vector of length m(m – 1)/2, corresponding to pairs of observations in a matrix with m rows

  • Distances arranged in the order (2,1), (3,1), ..., (m,1), (3,2), ..., (m,2), ..., (m,m – 1))

y can be a more general dissimilarity matrix conforming to the output format of pdist.

Data Types: single | double

Output Arguments

collapse all

Agglomerative hierarchical cluster tree, returned as a numeric matrix. Z is an (m – 1)-by-3 matrix, where m is the number of observations in the original data. Columns 1 and 2 of Z contain cluster indices linked in pairs to form a binary tree. The leaf nodes are numbered from 1 to m. Leaf nodes are the singleton clusters from which all higher clusters are built. Each newly formed cluster, corresponding to row Z(I,:), is assigned the index m + I. The entries Z(I,1) and Z(I,2) contain the indices of the two component clusters that form cluster m + I. The m – 1 higher clusters correspond to the interior nodes of the clustering tree. Z(I,3) contains the linkage distance between the two clusters merged in row Z(I,:).

For example, consider building a tree with 30 initial nodes. Suppose that cluster 5 and cluster 7 are combined at step 12, and that the distance between them at that step is 1.5. Then Z(12,:) is [5 7 1.5]. The newly formed cluster has index 12 + 30 = 42. If cluster 42 appears in a later row, then the function is combining the cluster created at step 12 into a larger cluster.

Data Types: single | double

More About

collapse all

Linkages

A linkage is the distance between two clusters.

The following notation describes the linkages used by the various methods:

  • Cluster r is formed from clusters p and q.

  • nr is the number of objects in cluster r.

  • xri is the ith object in cluster r.

  • Single linkage, also called nearest neighbor, uses the smallest distance between objects in the two clusters.

    d(r,s)=min(dist(xri,xsj)),i(i,...,nr),j(1,...,ns)

  • Complete linkage, also called farthest neighbor, uses the largest distance between objects in the two clusters.

    d(r,s)=max(dist(xri,xsj)),i(1,...,nr),j(1,...,ns)

  • Average linkage uses the average distance between all pairs of objects in any two clusters.

    d(r,s)=1nrnsi=1nrj=1nsdist(xri,xsj)

  • Centroid linkage uses the Euclidean distance between the centroids of the two clusters.

    d(r,s)=x¯rx¯s2,

    where

    x¯r=1nri=1nrxri

  • Median linkage uses the Euclidean distance between weighted centroids of the two clusters.

    d(r,s)=x˜rx˜s2,

    where x˜r and x˜s are weighted centroids for the clusters r and s. If cluster r was created by combining clusters p and q, x˜r is defined recursively as

    x˜r=12(x˜p+x˜q)

  • Ward's linkage uses the incremental sum of squares, that is, the increase in the total within-cluster sum of squares as a result of joining two clusters. The within-cluster sum of squares is defined as the sum of the squares of the distances between all objects in the cluster and the centroid of the cluster. The sum of squares metric is equivalent to the following distance metric d(r,s), which is the formula linkage uses.

    d(r,s)=2nrns(nr+ns)x¯rx¯s2,

    where

    • 2 is the Euclidean distance.

    • x¯r and x¯s are the centroids of clusters r and s.

    • nr and ns are the number of elements in clusters r and s.

    In some references, Ward's linkage does not use the factor of 2 multiplying nrns. The linkage function uses this factor so that the distance between two singleton clusters is the same as the Euclidean distance.

  • Weighted average linkage uses a recursive definition for the distance between two clusters. If cluster r was created by combining clusters p and q, the distance between r and another cluster s is defined as the average of the distance between p and s and the distance between q and s.

    d(r,s)=(d(p,s)+d(q,s))2

Tips

  • Computing linkage(y) can be slow when y is a vector representation of the distance matrix. For the 'centroid', 'median', and 'ward' methods, linkage checks whether y is a Euclidean distance. Avoid this time-consuming check by passing in X instead of y.

  • The 'centroid' and 'median' methods can produce a cluster tree that is not monotonic. This result occurs when the distance from the union of two clusters, r and s, to a third cluster is less than the distance between r and s. In this case, in a dendrogram drawn with the default orientation, the path from a leaf to the root node takes some downward steps. To avoid this result, use another method. This figure shows a nonmonotonic cluster tree.

    Nonmonotonic cluster tree

    In this case, cluster 1 and cluster 3 are joined into a new cluster, and the distance between this new cluster and cluster 2 is less than the distance between cluster 1 and cluster 3. The result is a nonmonotonic tree.

  • You can provide the output Z to other functions including dendrogram to display the tree, cluster to assign points to clusters, inconsistent to compute inconsistent measures, and cophenet to compute the cophenetic correlation coefficient.

Version History

Introduced before R2006a