iopzmap
使用默认选项绘制动态系统的 I/O 对组的零极点图
说明
示例
创建一个单输入双输出的动态系统。
H = [tf(-5 ,[1 -1]); tf([1 -5 6],[1 1 0])];
绘制零极点图。
iopzmap(H)
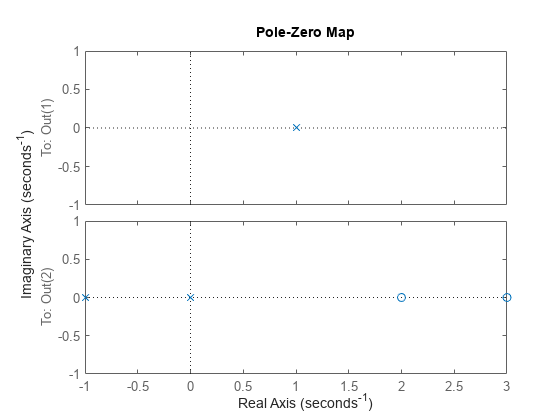
iopzmap 为系统中的每个 I/O 对组生成单独的零极点图。
查看从输入输出数据估计得到的过参数化状态空间模型的零极点。(需要 System Identification Toolbox™)。
load iddata1
sys = ssest(z1,6,ssestOptions('focus','simulation'));
iopzmap(sys)
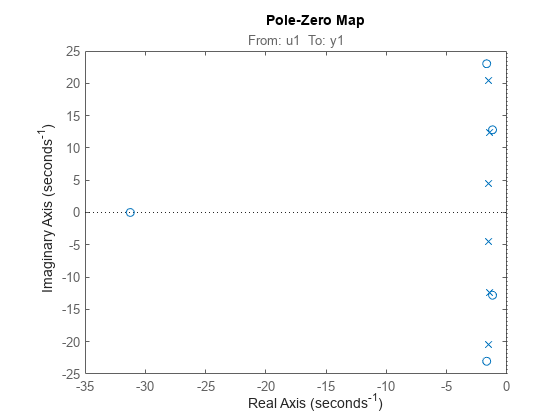
图中显示有两个几乎重叠的零极点对组,这暗示了它们可能存在冗余。
输入参数
提示
如需更多自定义零极点图外观的选项,请使用
iopzplot。使用
iopzmap创建的绘图不支持以字符串数组或字符向量元胞数组形式指定的多行标题或标签。要指定多行标题和标签,请使用包含newline字符的单个字符串。iopzmap(sys) title("first line" + newline + "second line");