拟合后处理
App
| 曲线拟合器 | 对数据进行曲线和曲面拟合 |
函数
cfit | cfit 对象的构造函数 |
coeffnames | cfit、sfit 或 fittype 对象的系数名称 |
coeffvalues | cfit 或 sfit 对象的系数值 |
confint | cfit 或 sfit 对象的拟合系数的置信区间 |
differentiate | Differentiate cfit or sfit object |
feval | 评估 cfit、sfit 或 fittype 对象 |
integrate | 对 cfit 对象求积分 |
plot | 绘制 cfit 或 sfit 对象 |
predint | Prediction intervals for cfit or sfit object |
probvalues | cfit 或 sfit 对象的问题相关参数值 |
quad2d | 对 sfit 对象进行数值积分 |
sfit | sfit 对象的构造函数 |
主题
- Create Multiple Fits in Curve Fitter App
Workflow for refining your fit, comparing multiple fits, and using statistics to determine the best fit.
- Explore and Customize Plots
In the Curve Fitter app, display fit, residual, surface, or contour plots; display prediction bounds and multiple plots; use zoom, pan, data cursor, and outliers modes; change colormap of surface and contour plots, change axes limits and print plots.
- Export Fit from Curve Fitter App to Simulink Lookup Table
Export a surface fit from the Curve Fitter app to a Simulink® 2-D lookup table.
- Remove Outliers
Remove points interactively or exclude them by rule in the Curve Fitter app. Alternatively, exclude outliers by using the
fitfunction. You can exclude data based on their distance from the model, in standard deviations. - 选择验证数据
在曲线拟合器中将您的拟合与验证数据或测试集进行比较。
- Generate Code and Export Fits to the Workspace
Generate MATLAB code from an interactive session in the Curve Fitter app, recreate fits and plots, and analyze fits in the workspace.
- 评估曲线拟合
此示例说明如何使用曲线拟合。
- 评估曲面拟合
此示例说明如何使用曲面拟合。
- Evaluating Goodness of Fit
After fitting data with one or more models, evaluate the goodness of fit using plots, statistics, residuals, and confidence and prediction bounds.
- Compare Fits in Curve Fitter App
Find the best fit by comparing visual and numeric results, including fitted coefficients and goodness-of-fit statistics.
- 通过编程方式比较拟合
此示例说明如何使用 Curve Fitting Toolbox™ 拟合并比较最高六次的多项式,并对部分人口普查数据进行拟合。它还显示如何对数据进行单项指数方程拟合,并将其与多项式模型拟合进行比较。
- Residual Analysis
The residuals from a fitted model are defined as the differences between the response data and the fit to the response data at each predictor value.
- Confidence and Prediction Bounds
Curve Fitting Toolbox software lets you calculate confidence bounds for the fitted coefficients, and prediction bounds for new observations or for the fitted function.
- 求拟合的微分和积分
此示例说明如何在预测变量值处求拟合的一阶和二阶导数以及拟合的积分。
精选示例
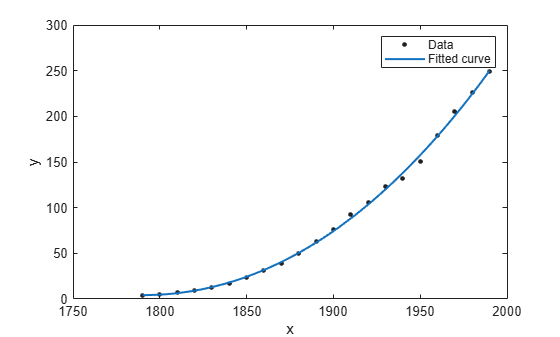
评估曲线拟合
此示例说明如何使用曲线拟合。

评估曲面拟合
此示例说明如何使用曲面拟合。
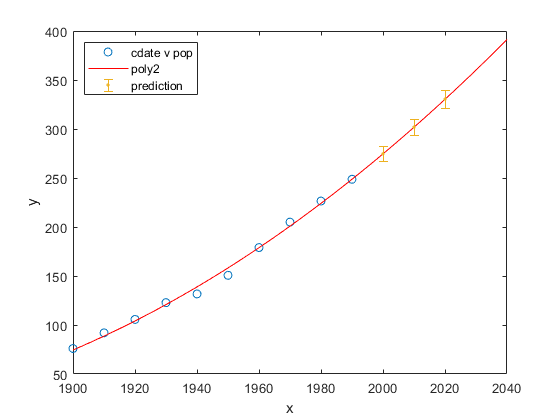
通过编程方式比较拟合
此示例说明如何使用 Curve Fitting Toolbox™ 拟合并比较最高六次的多项式,并对部分人口普查数据进行拟合。它还显示如何对数据进行单项指数方程拟合,并将其与多项式模型拟合进行比较。
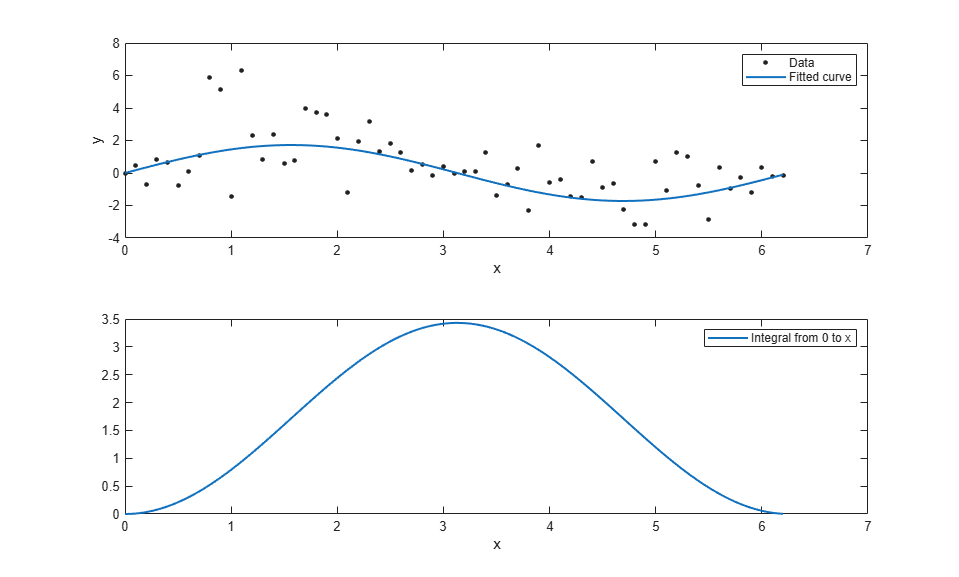
求拟合的微分和积分
此示例说明如何在预测变量值处求拟合的一阶和二阶导数以及拟合的积分。