Classify Tumors in Multiresolution Blocked Images
This example shows how to classify multiresolution whole slide images (WSIs) that might not fit in memory using an Inception-v3 deep neural network.
Deep learning methods for tumor classification rely on digital pathology, in which whole tissue slides are imaged and digitized. The resulting WSIs have high resolution, on the order of 200,000-by-100,000 pixels. WSIs are frequently stored in a multiresolution format to facilitate efficient display, navigation, and processing of images.
The example outlines an architecture to use block based processing to train large WSIs. The example trains an Inception-v3 based network using transfer learning techniques to classify individual blocks as normal or tumor.
If you do not want to download the training data and train the network, then continue to the Train Network or Download Pretrained Network section of this example.
Prepare Training Data
Prepare the training and validation data by following the instructions in Preprocess Multiresolution Images for Training Classification Network (Image Processing Toolbox). The preprocessing example saves the preprocessed training and validation datastores in the a file called trainingAndValidationDatastores.mat.
Set the value of the dataDir variable as the location where the trainingAndValidationDatastores.mat file is located. Load the training and validation datastores into variables called dsTrainLabeled and dsValLabeled.
dataDir = fullfile(tempdir,"Camelyon16");
load(fullfile(dataDir,"trainingAndValidationDatastores.mat"))
Set Up Inception-v3 Network Layers For Transfer Learning
This example uses an Inception-v3 network [2], a convolutional neural network that is trained on more than a million images from the ImageNet database [3]. The network is 48 layers deep and can classify images into 1,000 object categories, such as keyboard, mouse, pencil, and many animals.
The imagePretrainedNetwork function returns a pretrained Inception-v3 network. Inception-v3 requires the Deep Learning Toolbox™ Model for Inception-v3 Network support package. If this support package is not installed, then the function provides a download link.
The goal of this example is to perform binary segmentation between two classes, tumor and normal. Prepare the Inception-v3 network for transfer learning using two classes.
net = imagePretrainedNetwork("inceptionv3",numClasses=2);Specify Training Options
Train the network using root mean squared propagation (RMSProp) optimization. Specify the hyperparameter settings for RMSProp by using the trainingOptions function.
Reduce MaxEpochs to a small number because the large amount of training data enables the network to reach convergence sooner. Specify a MiniBatchSize according to your available memory. While larger mini-batch sizes can make the training faster, larger sizes can reduce the ability of the network to generalize. Set ResetInputNormalization to false to prevent a full read of the training data to compute normalization stats.
maxEpochs = 1;
miniBatchSize = 128;
options = trainingOptions("rmsprop", ...
    MaxEpochs=maxEpochs, ...
    MiniBatchSize=miniBatchSize, ...
    Shuffle="every-epoch", ...
    ValidationFrequency=250, ...
    InitialLearnRate=1e-4, ...
    SquaredGradientDecayFactor=0.99, ...
    ResetInputNormalization=false, ...
    Verbose=true, ...
    VerboseFrequency=1, ...
    Plots="training-progress");
Train Network or Download Pretrained Network
By default, this example downloads a pretrained version of the classification network. The pretrained network can be used to run the entire example without waiting for training to complete.
To train the network, set the doTraining variable in the following code to true. Train the model using the trainnet function. For classification, specify cross-entropy loss. By default, the trainnet function uses a GPU if one is available. Training on a GPU requires a Parallel Computing Toolbox™ license and a supported GPU device. For information on supported devices, see GPU Computing Requirements (Parallel Computing Toolbox). Otherwise, the trainnet function uses the CPU. To specify the execution environment, use the ExecutionEnvironment training option.
doTraining =false; if doTraining checkpointsDir = fullfile(dataDir,"checkpoints"); if ~exist(checkpointsDir,"dir") mkdir(checkpointsDir); end options.CheckpointPath=checkpointsDir; options.ValidationData=dsValLabeled; trainedNet = trainnet(dsTrainLabeled,net,"crossentropy",options); modelDateTime = string(datetime("now",Format="yyyy-MM-dd-HH-mm-ss")); save(dataDir+"trainedCamelyonNet-"+modelDateTime+".mat","trainedNet"); else trainedCamelyonNet_url = "https://www.mathworks.com/supportfiles/" + ... "vision/data/trainedCamelyonNet_v2.mat"; dataDir = fullfile(tempdir,"Camelyon16"); downloadTrainedNetwork(trainedCamelyonNet_url,dataDir); load(fullfile(dataDir,"trainedCamelyonNet_v2.mat")); end
Downloading pretrained network.
This can take several minutes to download...
Done.
Download Test Data
The Camelyon16 test data set consists of 130 WSIs. These images have both normal and tumor tissue. The size of each file is approximately 2 GB.
To download the test data, go to the Camelyon17 website and click the first "CAMELYON16 data set" link. Open the "testing" directory, then follow these steps.
Download the "lesion_annotations.zip" file. Extract all files to the directory specified by the
testAnnotationDirvariable.Open the "images" directory. Download the files to the directory specified by the
testImageDirvariable.
testDir = fullfile(dataDir,"testing");
testImageDir = fullfile(testDir,"images");
testAnnotationDir = fullfile(testDir,"lesion_annotations");
if ~exist(testDir,"dir")
    mkdir(testDir);
    mkdir(fullfile(testDir,"images"));
    mkdir(fullfile(testDir,"lesion_annotations"));
end
Preprocess Test Data
Create blockedImage Objects to Manage Test Images
Get the file names of the test images. Then, create an array of blockedImage (Image Processing Toolbox) objects that manage the test images. Each blockedImage object points to the corresponding image file on disk.
testFileSet = matlab.io.datastore.FileSet(testImageDir+filesep+"test*");
testImages = blockedImage(testFileSet);
Set the spatial referencing for all training data by using the setSpatialReferencingForCamelyon16 helper function. This function is attached to the example as a supporting file. The setSpatialReferencingForCamelyon16 function sets the WorldStart and WorldEnd properties of each blockedImage object using the spatial referencing information from the TIF file metadata.
testImages = setSpatialReferencingForCamelyon16(testImages);
Create Tissue Masks
To process the WSI data efficiently, create a tissue mask for each test image. This process is the same as the one used for the preprocessing the normal training images. For more information, see Preprocess Multiresolution Images for Training Classification Network (Image Processing Toolbox).
normalMaskLevel = 8;
testDir = fullfile(dataDir,"testing");
testTissueMaskDir = fullfile(testDir,"test_tissue_mask_level"+num2str(normalMaskLevel));

if ~isfolder(testTissueMaskDir)
    testTissueMasks = apply(testImages, @(bs)im2gray(bs.Data)<150, ...
        BlockSize=[512 512], ...
        Level=normalMaskLevel, ...
        UseParallel=canUseGPU, ...
        DisplayWaitbar=false, ...
        OutputLocation=testTissueMaskDir);
    save(fullfile(testTissueMaskDir,"testTissueMasks.mat"),"testTissueMasks")
else
    % Load previously saved data
    load(fullfile(testTissueMaskDir,"testTissueMasks.mat"),"testTissueMasks");
end
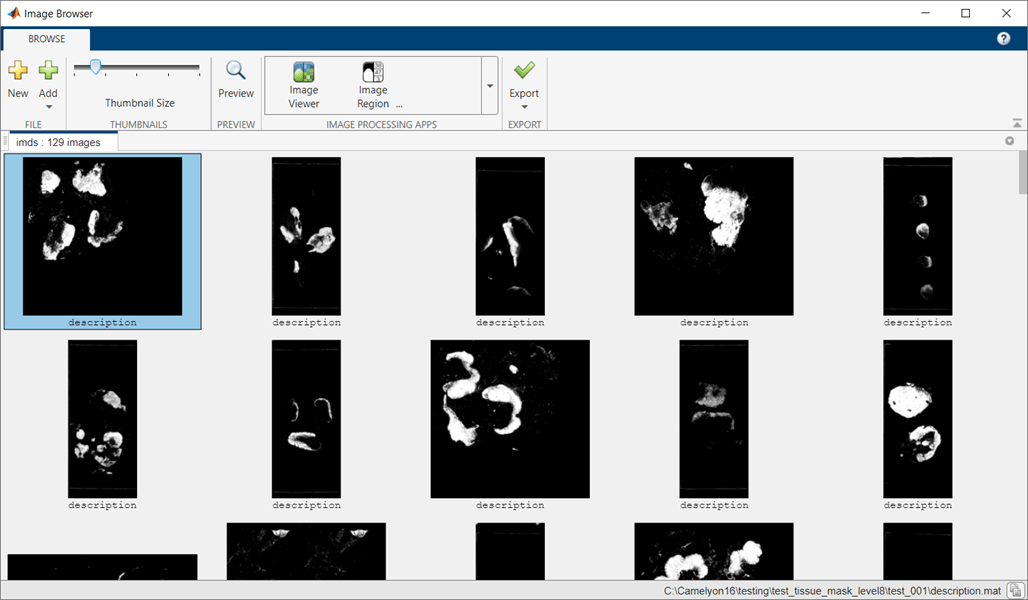
The tissue masks have only one level and are small enough to fit in memory. Display the tissue masks in the Image Browser app using the browseBlockedImages helper function. This helper function is attached to the example as a supporting file.
browseBlockedImages(testTissueMasks,1);

Preprocess Tumor Ground Truth Images
Specify the resolution level of the tumor masks.
tumorMaskLevel = 8;
Create a tumor mask for each ground truth tumor image using the createMaskForCamelyon16TumorTissue helper function. This helper function is attached to the example as a supporting file. The function performs these operations for each image:
Read the (x, y) boundary coordinates for all ROIs in the annotated XML file.
Separate the boundary coordinates for tumor and normal tissue ROIs into separate cell arrays.
Convert the cell arrays of boundary coordinates to a binary blocked image using the
polyToBlockedImage(Image Processing Toolbox) function. In the binary image, the ROI indicates tumor pixels and the background indicates normal tissue pixels. Pixels that are within both tumor and normal tissue ROIs are classified as background.
testTumorMaskDir = fullfile(testDir,['test_tumor_mask_level' num2str(tumorMaskLevel)]);
if ~isfolder(testTumorMaskDir)
    testTumorMasks = createMaskForCamelyon16TumorTissue(testImages, ...
        testAnnotationDir,testTumorMaskDir,tumorMaskLevel);
    save(fullfile(testTumorMaskDir,"testTumorMasks.mat"),"testTumorMasks")
else
    load(fullfile(testTumorMaskDir,"testTumorMasks.mat"),"testTumorMasks");
end
Predict Heatmaps of Tumor Probability
Use the trained classification network to predict a heatmap for each test image. The heatmap gives a probability score that each block is of the tumor class. The example performs these operations for each test image to create a heatmap:
Select blocks using the
selectBlockLocations(Image Processing Toolbox) function. Include all blocks that have at least one tissue pixel by specifying theInclusionThresholdname-value argument as0.Process batches of blocks using the
apply(Image Processing Toolbox) function with the processing operations defined by thepredictBlockhelper function. The helper function is attached to the example as a supporting file. ThepredictBlockhelper function calls thepredictfunction on a block of data and returns the probability score that the block istumor.Write the heatmap data to a TIF file using the
write(Image Processing Toolbox) function. The final output after processing all blocks is a heatmap showing the probability of finding tumors over the entire WSI.
numTest = numel(testImages);
outputHeatmapsDir = fullfile(testDir,"heatmaps");
networkBlockSize = [299,299,3];

for ind = 1:numTest
    % Check if TIF file already exists
    [~,id] = fileparts(testImages(ind).Source);
    outFile = fullfile(outputHeatmapsDir,id+".tif");
    if ~exist(outFile,"file")
        bls = selectBlockLocations(testImages(ind),Levels=1, ...
            BlockSize=networkBlockSize, ...
            Mask=testTissueMasks(ind),InclusionThreshold=0);

        % Resulting heat maps are in-memory blockedImage objects
        bhm = apply(testImages(ind),@(x)predictBlockForCamelyon16(x,trainedNet), ...
            Level=1,BlockLocationSet=bls,BatchSize=128, ...
            PadPartialBlocks=true,DisplayWaitBar=false);

        % Write results to a TIF file
        write(bhm,outFile,BlockSize=[512 512]);
    end
end
Elapsed time is 0.156674 seconds.
Collect all of the written heatmaps as an array of blockedImage objects.
heatMapFileSet = matlab.io.datastore.FileSet(outputHeatmapsDir,FileExtensions=".tif");
bheatMapImages = blockedImage(heatMapFileSet);
Visualize Heatmap
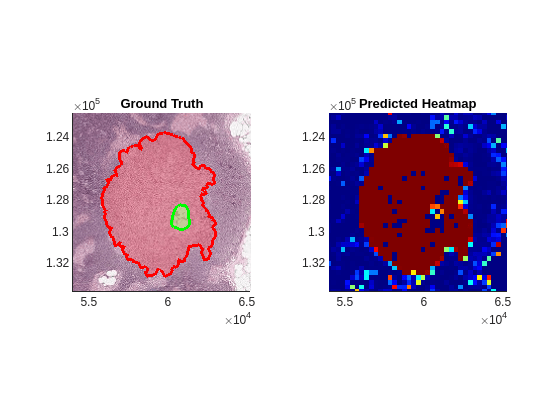
Select a test image to display. On the left side of a figure, display the ground truth boundary coordinates as freehand ROIs using the showCamelyon16TumorAnnotations helper function. This helper function is attached to the example as a supporting file. Normal regions (shown with a green boundary) can occur inside tumor regions (shown with a red boundary).
idx = 27;
figure
tiledlayout(1,2)
nexttile
hBim1 = showCamelyon16TumorAnnotations(testImages(idx),testAnnotationDir);
title("Ground Truth")
On the right side of the figure, display the heatmap for the test image.
nexttile
hBim2 = bigimageshow(bheatMapImages(idx),Interpolation="nearest");
colormap(jet)
Link the axes and zoom in to an area of interest.
linkaxes([hBim1.Parent,hBim2.Parent])
xlim([53982, 65269])
ylim([122475, 133762])
title("Predicted Heatmap")
Identify Threshold with AUC-ROC Curve
Split the test data set into a test data set and a validation data set.
rng("default")
valPercent = 0.3;
datapartition = cvpartition(numTest,"Holdout",valPercent);
idxTest = training(datapartition);
idxVal = test(datapartition);
Use the heatmaps and ground truth masks at the coarsest resolution for validation. Resize and refine the ground truth masks to match the size of the heatmap. Create a vector named labels containing the ground truth classification of each pixel of each image in the validation data set. You can obtain the ground truth classification from the tumor masks. Similarly, create a vector named scores containing the heatmap score of each pixel of each image in the validation data set.
labels = [];
scores = [];
for ind = find(idxVal)'
    heatMap = gather(bheatMapImages(ind));
    tissueMask = gather(testTissueMasks(ind));
    tissueMask = imresize(tissueMask,size(heatMap),"nearest");
    tissueMask = tissueMask | heatMap>0;
    tumorMask = gather(testTumorMasks(ind));
    tumorMask = imresize(tumorMask,size(heatMap),"nearest");
    heatMap = heatMap.*tissueMask;
    tumorMask = tumorMask.*tissueMask;
    labels = [labels; reshape(tumorMask,[],1)];
    scores = [scores; reshape(heatMap,[],1)];
end
Calculate the ROC curve values on the validation data set at different thresholds by using the rocmetrics function. Calculate the area under the curve (AUC) metric. The metric returns a value in the range [0, 1], where 1 indicates perfect model performance. The AUC for this data set is close to 1.
roc = rocmetrics(labels,scores,true,AdditionalMetrics="PositivePredictiveValue");roc =
rocmetrics with properties:
Metrics: [910020×5 table]
AUC: 0.9462
Properties, Methods
roc.AUC
ans = single
    0.9462
Choose the optimal threshold that maximizes the F1 score.
precisionValues = roc.Metrics.PositivePredictiveValue;
recallValues = roc.Metrics.TruePositiveRate;
F1score = 2.*precisionValues.*recallValues./(precisionValues+recallValues);
[~,threshIdx] = max(F1score);
thresh = roc.Metrics.Threshold(threshIdx)
thresh = single
    0.6942
Plot the ROC curve and the optimal operating point.
figure
plot(roc)
hold on
scatter(roc.Metrics.FalsePositiveRate(threshIdx), ...
    roc.Metrics.TruePositiveRate(threshIdx), ...
    "filled",DisplayName="true Optimal Operating Point")
hold off

Classify Test Images at Specific Threshold
Classify the blocks in each test image and calculate the confusion matrix using the apply (Image Processing Toolbox) function with the processing operations defined by the computeBlockConfusionMatrixForCamelyon16 helper function. The helper function is attached to the example as a supporting file.
The computeBlockConfusionMatrixForCamelyon16 helper function performs these operations on each heatmap:
Resize and refine the ground truth mask to match the size of the heatmap.
Apply the threshold on the heatmap.
Calculate a confusion matrix for all of the blocks at the finest resolution level. The confusion matrix gives the number of true positive (TP), false positive (FP), true negative (TN), and false negative (FN) classification predictions.
Save the total counts of TP, FP, TN, and FN blocks as a structure in a blocked image. The blocked image is returned as an element in the array of blocked images,
bcmatrix.Save a numeric labeled image of the classification predictions in a blocked image. The values 0, 1, 2, and 3 correspond to TN, FP, FN, and TP results, respectively. The blocked image is returned as an element in the array of blocked images,
bcmatrixImage.
for ind = find(idxTest)'
    [bcmatrix(ind),bcmatrixImage{ind}] = apply(bheatMapImages(ind), ...
        @(bs,tumorMask,tissueMask)computeBlockConfusionMatrixForCamelyon16(bs, ...
            tumorMask,tissueMask,thresh), ...
        ExtraImages=[testTumorMasks(ind),testTissueMasks(ind)]);
end
Calculate the global confusion matrix over all test images.
bcmatrixEval = bcmatrix(idxTest);
cmArray = arrayfun(@(c)gather(c),bcmatrixEval);
cm = [sum([cmArray.tp]),sum([cmArray.fn]);
    sum([cmArray.fp]),sum([cmArray.tn])];
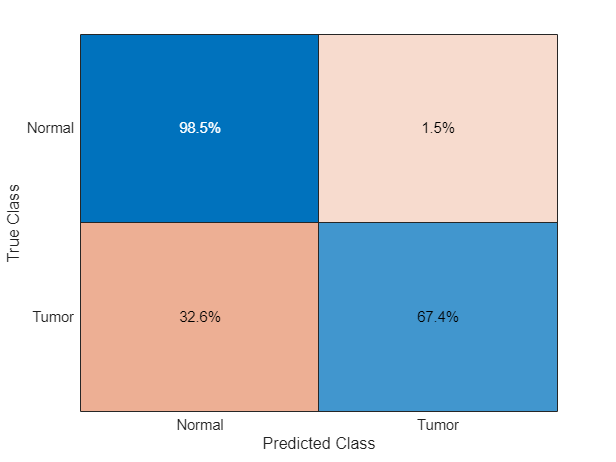
Display the confusion chart of the normalized global confusion matrix. The majority of blocks in the WSI images are of normal tissue, resulting in a high percentage of true negative predictions. Observe that the false negative predictions are very low. This ensures that presence of a tumor is not missed.
figure
confusionchart(cm,["Tumor","Normal"],Normalization="row-normalized")

Visualize Classification Results
Compare the ground truth ROI boundary coordinates with the classification results. On the left side of a figure, display the ground truth boundary coordinates as freehand ROIs. On the right side of the figure, display the test image and overlay a color on each block based on the confusion matrix. Display true positives as red, false positives as cyan, false negatives as yellow, and true negatives with no color.
False negatives and false positives appear around the edges of the tumor region, which indicates that the network has difficulty classifying blocks with partial classes.
idx = 27;
figure
tiledlayout(1,2)
nexttile
hBim1 = showCamelyon16TumorAnnotations(testImages(idx),testAnnotationDir);
title("Ground Truth")
nexttile
hBim2 = bigimageshow(testImages(idx));
cmColormap = [0 0 0; 0 1 1; 1 1 0; 1 0 0];
showlabels(hBim2,bcmatrixImage{idx}, ...
    Colormap=cmColormap,AlphaData=bcmatrixImage{idx})
title("Classified Blocks")
linkaxes([hBim1.Parent,hBim2.Parent])
xlim([56000 63000])
ylim([125000 132600])

Note: To reduce the classification error around the perimeter of the tumor, you can retrain the network with less homogenous blocks. When preprocessing the Tumor blocks of the training data set, reduce the value of the InclusionThreshold name-value argument.
References
[1] Ehteshami Bejnordi, Babak, Mitko Veta, Paul Johannes van Diest, Bram van Ginneken, Nico Karssemeijer, Geert Litjens, Jeroen A. W. M. van der Laak, et al. “Diagnostic Assessment of Deep Learning Algorithms for Detection of Lymph Node Metastases in Women With Breast Cancer.” JAMA 318, no. 22 (December 12, 2017): 2199–2210. https://doi.org/10.1001/jama.2017.14585.
[2] Szegedy, Christian, Vincent Vanhoucke, Sergey Ioffe, Jonathon Shlens, and Zbigniew Wojna. “Rethinking the Inception Architecture for Computer Vision.” Preprint, submitted December 2, 2015. https://arxiv.org/abs/1512.00567v3.
[3] ImageNet. https://www.image-net.org.
See Also
trainnet | trainingOptions | dlnetwork | blockedImageDatastore (Image Processing Toolbox) | blockedImage (Image Processing Toolbox) | blockLocationSet (Image Processing Toolbox) | selectBlockLocations (Image Processing Toolbox) | bigimageshow (Image Processing Toolbox)
Related Examples
- Preprocess Multiresolution Images for Training Classification Network (Image Processing Toolbox)
More About
- Set Up Spatial Referencing for Blocked Images (Image Processing Toolbox)
- Process Blocked Images Efficiently Using Partial Images or Lower Resolutions (Image Processing Toolbox)
- Process Blocked Images Efficiently Using Mask (Image Processing Toolbox)
- Create Labeled Blocked Image from ROIs and Masks (Image Processing Toolbox)
- Datastores for Deep Learning
- List of Deep Learning Layers
