spotDiagram
Description
Add-On Required: This feature requires the Optical Design and Simulation Library for Image Processing Toolbox add-on.
A SpotDiagram object stores information used to display the spot
distribution on the image plane of an optical system. You can change aspects of the display,
such as the title, line color, and legend, by modifying properties of the
SpotDiagram object.
Creation
Description
spd = spotDiagram(spotResult)spotResult in 2-D.
spd = spotDiagram(spotResult,Name=Value)Title="RMS Spot Size" specifies the visualization plot
title as "RMS Spot Size".
Input Arguments
Name-Value Arguments
Specify optional pairs of arguments as
Name1=Value1,...,NameN=ValueN, where Name is
the argument name and Value is the corresponding value.
Name-value arguments must appear after other arguments, but the order of the
pairs does not matter.
Example: spd = spotDiagram(opsys,Title="RMS Spot Size") specifies
the chart title as "RMS spot size".
Index of the reference wavelength at which the RMS spot size was calculated, specified as a positive integer in the range (1, M), where M is the number of wavelengths. The spot diagram is centered at the chief ray of this wavelength.
This argument sets the ReferenceWavelengthIndex property.
Example: ReferenceWavelengthIndex=2 uses the second wavelength
of spotResult.Wavelengths as the reference
wavelength.
Plot the spot diagrams on a single axes, specified as "on" or
"off", or as numeric or logical 1
(true) or 0 (false). A
value of "on" is equivalent to true, and
"off" is equivalent to false. The value is
stored as an on/off logical value of type matlab.lang.OnOffSwitchState.
When you specify CombineWavelengths as
"off", the spotDiagram function plots the
spot diagram for each wavelength on a separate axes.
This argument sets the CombineWavelengths property.
Line color, specified as an RGB triplet, a hexadecimal color code, or a color name. You can also specify multiple colors as an M-by-3 numeric matrix where each row is an RGB triplet, or as an M-element string vector where each element is a hexadecimal color code or color name. If you specify a single color, the chart displays all results using the same color. If you specify multiple colors, then M must be equal to the number of wavelengths.
For a custom color, specify an RGB triplet or a hexadecimal color code.
An RGB triplet is a three-element row vector whose elements specify the intensities of the red, green, and blue components of the color. The intensities must be in the range
[0,1], for example,[0.4 0.6 0.7].A hexadecimal color code is a string scalar or character vector that starts with a hash symbol (
#) followed by three or six hexadecimal digits, which can range from0toF. The values are not case sensitive. Therefore, the color codes"#FF8800","#ff8800","#F80", and"#f80"are equivalent.
Alternatively, you can specify some common colors by name. This table lists the named color options, the equivalent RGB triplets, and the hexadecimal color codes.
| Color Name | Short Name | RGB Triplet | Hexadecimal Color Code | Appearance |
|---|---|---|---|---|
"red" | "r" | [1 0 0] | "#FF0000" |
|
"green" | "g" | [0 1 0] | "#00FF00" |
|
"blue" | "b" | [0 0 1] | "#0000FF" |
|
"cyan"
| "c" | [0 1 1] | "#00FFFF" |
|
"magenta" | "m" | [1 0 1] | "#FF00FF" |
|
"yellow" | "y" | [1 1 0] | "#FFFF00" |
|
"black" | "k" | [0 0 0] | "#000000" |
|
"white" | "w" | [1 1 1] | "#FFFFFF" |
|
This argument sets the Color property.
Example: Color="r"
Example: Color="green"
Example: Color=[0 0.4470 0.7410]
Marker symbol for each wavelength, specified as one of the options listed in the table. You can also specify multiple symbols as an M-element string vector where each element is a marker shape from the table. If you specify a single symbol, the chart displays all results using the same symbol. If you specify multiple symbols, then M must be equal to the number of wavelengths.
| Marker | Description | Resulting Marker |
|---|---|---|
"o" | Circle |
|
"+" | Plus sign |
|
"*" | Asterisk |
|
"." | Point |
|
"x" | Cross |
|
"_" | Horizontal line |
|
"|" | Vertical line |
|
"square" | Square |
|
"diamond" | Diamond |
|
"^" | Upward-pointing triangle |
|
"v" | Downward-pointing triangle |
|
">" | Right-pointing triangle |
|
"<" | Left-pointing triangle |
|
"pentagram" | Pentagram |
|
"hexagram" | Hexagram |
|
"none" | No markers | Not applicable |
This argument sets the Marker
property.
Chart title, specified as a string scalar or character vector.
This argument sets the Title property.
Data Types: char | string
Legend display, specified as "on" or
"off", or as numeric or logical 1
(true) or 0 (false). A
value of "on" is equivalent to true, and
"off" is equivalent to false. The value is
stored as an on/off logical value of type matlab.lang.OnOffSwitchState.
This argument sets the Legend property.
Grid lines to display, specified as one of these options.
"major"— The visualization displays only major grid lines."minor"— The visualization displays major and minor grid lines."off"— The visualization does not display any grid lines.
This argument sets the Grid property.
Data Types: char | string
Parent UI container, specified as a Figure object,
Panel object, Tab object, or
GridLayout object. By default, the function creates a new
Figure object. You can create these UI containers using their
respective creation functions.
UI Figure —
uifigureUI Panel —
uipanelUI Tab —
uitabUI Grid Layout —
uigridlayout
This argument sets the Parent property.
Output Arguments
Properties
This property is read-only after object creation.
Spot analysis result, specified as a Spot
object.
This property is read-only after object creation.
Index of the reference wavelength for which the spot diagram was computed, specified as a positive integer in the range (1, M), where M is the number of wavelengths. The spot diagram is centered at the chief ray of the reference wavelength.
Plot the spot diagrams on a single axes, specified as "on" or
"off", or as numeric or logical 1
(true) or 0 (false). A value
of "on" is equivalent to true, and
"off" is equivalent to false. The value is
stored as an on/off logical value of type matlab.lang.OnOffSwitchState.
When you specify CombineWavelengths as
"off", the spotDiagram function plots the spot
diagram for each wavelength on a separate axes.
Line color, specified as an RGB triplet, a hexadecimal color code, or a color name. You can also specify multiple colors as an M-by-3 numeric matrix where each row is an RGB triplet, or as an M-element string vector where each element is a hexadecimal color code or color name. If you specify a single color, the chart displays all results using the same color. If you specify multiple colors, then M must be equal to the number of wavelengths.
For a custom color, specify an RGB triplet or a hexadecimal color code.
An RGB triplet is a three-element row vector whose elements specify the intensities of the red, green, and blue components of the color. The intensities must be in the range
[0,1], for example,[0.4 0.6 0.7].A hexadecimal color code is a string scalar or character vector that starts with a hash symbol (
#) followed by three or six hexadecimal digits, which can range from0toF. The values are not case sensitive. Therefore, the color codes"#FF8800","#ff8800","#F80", and"#f80"are equivalent.
Alternatively, you can specify some common colors by name. This table lists the named color options, the equivalent RGB triplets, and the hexadecimal color codes.
| Color Name | Short Name | RGB Triplet | Hexadecimal Color Code | Appearance |
|---|---|---|---|---|
"red" | "r" | [1 0 0] | "#FF0000" |
|
"green" | "g" | [0 1 0] | "#00FF00" |
|
"blue" | "b" | [0 0 1] | "#0000FF" |
|
"cyan"
| "c" | [0 1 1] | "#00FFFF" |
|
"magenta" | "m" | [1 0 1] | "#FF00FF" |
|
"yellow" | "y" | [1 1 0] | "#FFFF00" |
|
"black" | "k" | [0 0 0] | "#000000" |
|
"white" | "w" | [1 1 1] | "#FFFFFF" |
|
Example: Color="r"
Example: Color="green"
Example: Color=[0 0.4470 0.7410]
Marker symbol for each wavelength, specified as one of the options listed in the table. You can also specify multiple symbols as an M-element string vector where each element is a marker shape from the table. If you specify a single symbol, the chart displays all results using the same symbol. If you specify multiple symbols, then M must be equal to the number of wavelengths.
| Marker | Description | Resulting Marker |
|---|---|---|
"o" | Circle |
|
"+" | Plus sign |
|
"*" | Asterisk |
|
"." | Point |
|
"x" | Cross |
|
"_" | Horizontal line |
|
"|" | Vertical line |
|
"square" | Square |
|
"diamond" | Diamond |
|
"^" | Upward-pointing triangle |
|
"v" | Downward-pointing triangle |
|
">" | Right-pointing triangle |
|
"<" | Left-pointing triangle |
|
"pentagram" | Pentagram |
|
"hexagram" | Hexagram |
|
"none" | No markers | Not applicable |
Chart title, specified as a string scalar or character vector.
Data Types: char | string
Legend display, specified as "on" or "off", or
as numeric or logical 1 (true) or
0 (false). A value of "on"
is equivalent to true, and "off" is equivalent to
false. The value is stored as an on/off logical value of type
matlab.lang.OnOffSwitchState.
Grid lines to display, specified as one of these options.
"major"— The chart displays only major grid lines."minor"— The chart displays major and minor grid lines."off"— The chart does not display any grid lines.
Data Types: char | string
Parent UI container, specified as a Figure object,
Panel object, Tab object, or
TiledChartLayout object. By default, the function creates a new
Figure object. You can create these UI containers using their
respective creation functions.
UI Figure —
uifigureUI Panel —
uipanelUI Tab —
uitabUI Tiled Layout —
tiledlayout
Examples
Create an empty optical system.
opsys = opticalSystem;
To create a doublet lens, add the three refractive surfaces of the doublet to the optical system using the addRefractiveSurface object function.
addRefractiveSurface(opsys,Radius=10,DistanceToNext=4,Material="N-BK7")
addRefractiveSurface(opsys,Radius=-10,DistanceToNext=2,Material="F2")
addRefractiveSurface(opsys,DistanceToNext=10)
addRefractiveSurface(opsys,Radius=10,DistanceToNext=4,Material="N-BK7")
addRefractiveSurface(opsys,Radius=-10)
Create a gap using the addGap object function, and add an image plane using the addImagePlane object function.
addGap(opsys,2)
addImagePlane(opsys)
Display a 2-D visualization of the initial optical system by using the view2d object function.
view2d(opsys,Title="Initial Doublet");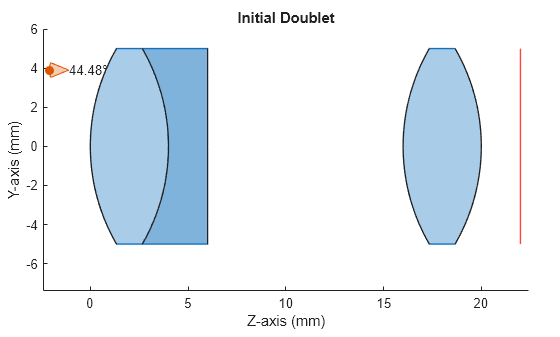
Create a copy of the initial optical system opsys.
opsys2 = copy(opsys);
Focus the copied optical system by shifting the image plane to a position where the RMS spot size is minimal. Display a 2-D visualization of the optical system by using the view2d object function. Trace rays and add them to the visualization using the addRays function.
sp = focus(opsys2);
hv = view2d(opsys2,Title="Focused Doublet");
addRays(hv)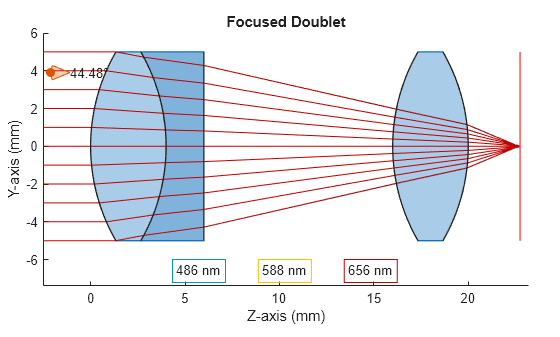
Compute the spot diagram of the initial optical system and the spot diagram of the focused system by using the spot object function.
spotBefore = spot(opsys);
spotAfter = spot(opsys2);
Display the spot diagrams by using the spotDiagram object function.
spotDiagram(spotBefore,Title="Initial Spot");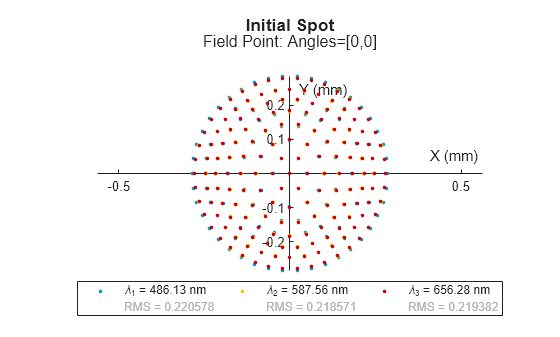
spotDiagram(spotAfter,Title="Focused Spot");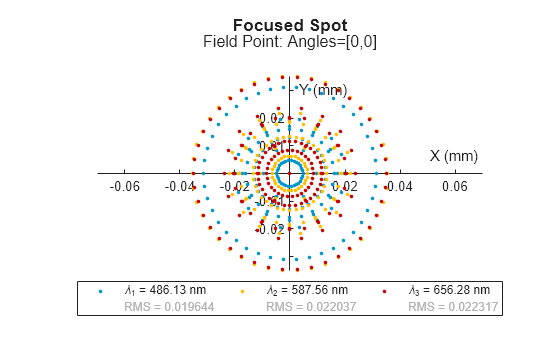
Version History
Introduced in R2026a