在地图上创建绘图
R2026b点、线和多边形;气泡图;图像;伪彩图
在地理坐标区和地图坐标区上可视化数据。有关可以使用地理坐标区和地图坐标区创建的绘图类型的示例,请参阅Types of 2-D Geographic Plots。有关地理坐标区与地图坐标区之间区别的信息,请参阅选择二维地图显示。
函数
属性
主题
绘图
- Create 2-D Plots Using Map Axes
Display data on a map using point, line, and polygon plots, bubble charts, images, and pseudocolor raster plots. - Create Maps Using Icons
Use icons on maps to represent and display data, animate movement along paths, and annotate basemaps. (自 R2024b 起) - Control Color and Transparency of Icon Chart
Change the color or hide the background of an icon by using the color and transparency properties of the icon chart object. (自 R2024b 起) - Create Binned Scatter Plot from Latitude and Longitude Data
Display a binned scatter plot on a map using data in latitude and longitude coordinates. (自 R2026a 起)
动画和 APP
- Create Animations Using Latitude and Longitude Data
Animate geographic data using comet plots, animated lines, and markers along lines. - Create Animations Using Raster Data
Visualize changes over time by animating raster data on a map. (自 R2026a 起) - Create Map Axes in App
Use App Designer to create an app that includes a map axes object and components that control the map projection and the visibility of plotted data.
相关信息
精选示例
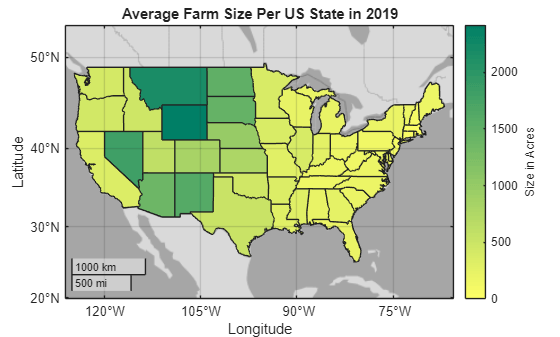
Create Choropleth Map from Table Data
Create a map that illustrates numeric attributes using colors along a gradient.
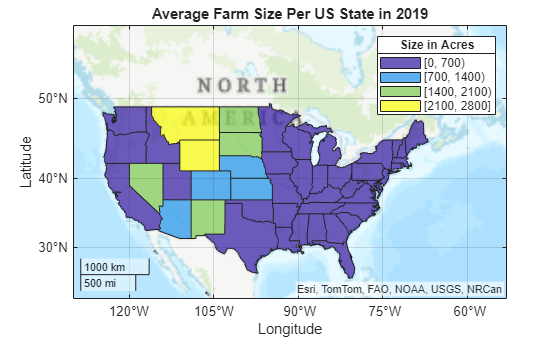
Create Classification Map from Table Data
Create a map that illustrates categorical attributes using discrete colors.

