plot
绘制图节点和边
说明
plot(___, 使用一个或多个名称-值对组参量(采用上述语法中的任意输入参量组合)指定的其他选项。例如,Name,Value)plot(G,'Layout','circle') 绘制图形的圆环形布局,plot(G,'XData',X,'YData',Y,'ZData',Z) 指定图形节点的 (X,Y,Z) 坐标。
plot( 将图形绘制到 ax,___)ax 指定的坐标区中,而不是当前坐标区 (gca) 中。选项 ax 可以位于上述语法中的任何输入参量组合之前。
示例
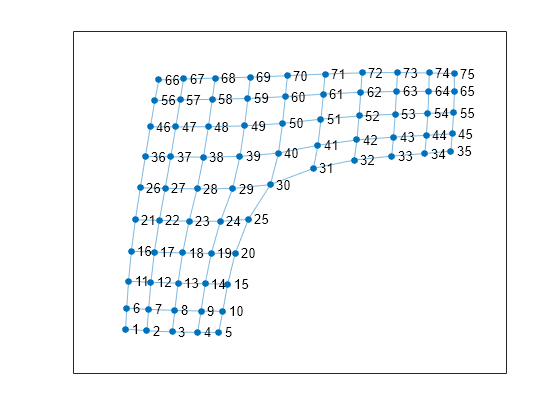
使用稀疏邻接矩阵创建一个图,然后绘制该图。
n = 10;
A = delsq(numgrid('L',n+2));
G = graph(A,'omitselfloops')
G =
  graph with properties:

    Edges: [130×2 table]
    Nodes: [75×0 table]
plot(G)
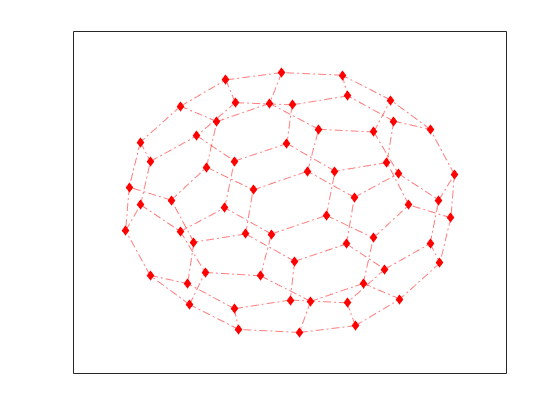
创建并绘制一个图。指定 LineSpec 输入来更改图论图的 Marker、NodeColor 和/或 LineStyle。
G = graph(bucky);
plot(G,'-.dr','NodeLabel',{})
创建一个有向图,然后使用 'force' 布局绘制该图。
G = digraph(1,2:5);
G = addedge(G,2,6:15);
G = addedge(G,15,16:20)
G =
  digraph with properties:

    Edges: [19×1 table]
    Nodes: [20×0 table]
plot(G,'Layout','force')

创建一个加权图。
s = [1 1 1 1 1 2 2 7 7 9 3 3 1 4 10 8 4 5 6 8];
t = [2 3 4 5 7 6 7 5 9 6 6 10 10 10 11 11 8 8 11 9];
weights = [1 1 1 1 3 3 2 4 1 6 2 8 8 9 3 2 10 12 15 16];
G = graph(s,t,weights)
G =
  graph with properties:

    Edges: [20×2 table]
    Nodes: [11×0 table]
使用节点的自定义坐标绘制图。使用 XData 指定 x 坐标,使用 YData 指定 y 坐标,使用 ZData 指定 z 坐标。使用 EdgeLabel 用边权重为边添加标签。
x = [0 0.5 -0.5 -0.5 0.5 0 1.5 0 2 -1.5 -2];
y = [0 0.5 0.5 -0.5 -0.5 2 0 -2 0 0 0];
z = [5 3 3 3 3 0 1 0 0 1 0];
plot(G,'XData',x,'YData',y,'ZData',z,'EdgeLabel',G.Edges.Weight)

从上方观看图形。
view(2)

创建一个加权图。
s = [1 1 1 1 2 2 3 4 4 5 6];
t = [2 3 4 5 3 6 6 5 7 7 7];
weights = [50 10 20 80 90 90 30 20 100 40 60];
G = graph(s,t,weights)
G =
  graph with properties:

    Edges: [11×2 table]
    Nodes: [7×0 table]
绘制图,用边权重为边添加标签,使各边的宽度与其权重成比例。使用重新调整后的边权重来确定每条边的宽度,其中最大线宽为 5。
LWidths = 5*G.Edges.Weight/max(G.Edges.Weight);
plot(G,'EdgeLabel',G.Edges.Weight,'LineWidth',LWidths)

创建一个有向图。绘制图,并为节点和边添加自定义标签。
s = [1 1 1 2 2 3 3 4 4 5 6 7];
t = [2 3 4 5 6 5 7 6 7 8 8 8];
G = digraph(s,t)
G =
  digraph with properties:

    Edges: [12×1 table]
    Nodes: [8×0 table]
eLabels = {'x' 'y' 'z' 'y' 'z' 'x' 'z' 'x' 'y' 'z' 'y' 'x'};
nLabels = {'{0}','{x}','{y}','{z}','{x,y}','{x,z}','{y,z}','{x,y,z}'};
plot(G,'Layout','force','EdgeLabel',eLabels,'NodeLabel',nLabels)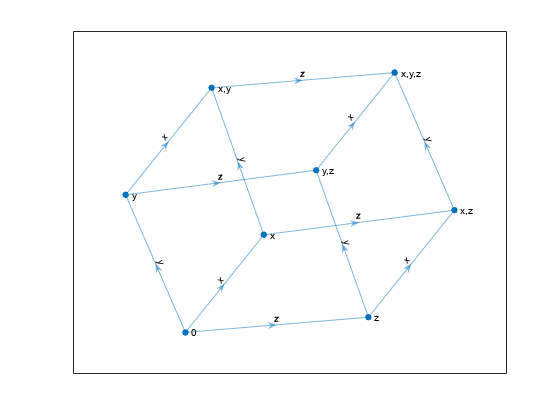
创建并绘制一个有向图。指定 plot 的输出参量以返回 GraphPlot 对象的句柄。
s = [1 1 1 2 2 3 3 4 5 5 6 7 7 8 8 9 10 11];
t = [2 3 10 4 12 4 5 6 6 7 9 8 10 9 11 12 11 12];
G = digraph(s,t)
G =
  digraph with properties:

    Edges: [18×1 table]
    Nodes: [12×0 table]
p = plot(G)

p =
  GraphPlot with properties:

     NodeColor: [0.0660 0.4430 0.7450]
    MarkerSize: 4
        Marker: 'o'
     EdgeColor: [0.0660 0.4430 0.7450]
     LineWidth: 0.5000
     LineStyle: '-'
     NodeLabel: {'1'  '2'  '3'  '4'  '5'  '6'  '7'  '8'  '9'  '10'  '11'  '12'}
     EdgeLabel: {}
         XData: [2.5000 1.5000 2.5000 2 3 2 3 3 2.5000 4 3.5000 2.5000]
         YData: [7 6 6 5 5 4 4 3 2 3 2 1]
         ZData: [0 0 0 0 0 0 0 0 0 0 0 0]

  Show all properties
更改节点的颜色和标记。
p.Marker = 's';
p.NodeColor = 'r';

增加节点的大小。
p.MarkerSize = 7;

更改边的线型。
p.LineStyle = '--';
更改节点的 x 和 y 坐标。
p.XData = [2 4 1.5 3.5 1 3 1 2.1 3 2 3.1 4];
p.YData = [3 3 3.5 3.5 4 4 2 2 2 1 1 1];

输入参数
线型、标记符号和颜色,指定为符号的字符向量或字符串向量。符号可以按任意顺序出现,而且您可以省略一个或多个特征。如果您省略线型,绘图会将图边显示为实线。
示例: '--or' 用红圈作为节点标记,用红色虚线表示边。
示例: 'r*' 用红色星号作为节点标记,用红色实线表示边。
| 线型 | 描述 | 表示的线条 |
|---|---|---|
"-" | 实线 |
|
"--" | 虚线 |
|
":" | 点线 |
|
"-." | 点划线 |
|


| 标记 | 描述 | 生成的标记 |
|---|---|---|
"o" | 圆圈 |
|
"+" | 加号 |
|
"*" | 星号 |
|
"." | 点 |
|
"x" | 叉号 |
|
"_" | 水平线条 |
|
"|" | 垂直线条 |
|
"square" | 方形 |
|
"diamond" | 菱形 |
|
"^" | 上三角 |
|
"v" | 下三角 |
|
">" | 右三角 |
|
"<" | 左三角 |
|
"pentagram" | 五角形 |
|
"hexagram" | 六角形 |
|


| 颜色名称 | 短名称 | RGB 三元组 | 外观 |
|---|---|---|---|
"red" | "r" | [1 0 0] |
|
"green" | "g" | [0 1 0] |
|
"blue" | "b" | [0 0 1] |
|
"cyan" | "c" | [0 1 1] |
|
"magenta" | "m" | [1 0 1] |
|
"yellow" | "y" | [1 1 0] |
|
"black" | "k" | [0 0 0] |
|
"white" | "w" | [1 1 1] |
|
坐标区对象。如果您不指定坐标区对象,则 plot 使用当前坐标区 (gca)。
名称-值参数
将可选参量对组指定为 Name1=Value1,...,NameN=ValueN,其中 Name 是参量名称,Value 是对应的值。名称-值参量必须出现在其他参量之后,但对各个参量对组的顺序没有要求。
如果使用的是 R2021a 之前的版本,请使用逗号分隔每个名称和值,并用引号将 Name 引起来。
示例: p = plot(G,'EdgeColor','r','NodeColor','k','LineStyle','--')
此处所列的图属性只是一部分。有关完整列表,请参阅 GraphPlot 属性。
注意
ArrowSize 仅影响使用 digraph 创建的有向图的显示。
箭头大小,指定为逗号分隔的对组,其中包含 'ArrowSize' 和一个正值(以磅为单位)。对于具有 100 个或更少节点的图,ArrowSize 的默认值是 7,对于超过 100 个节点的图,默认值是 4。
示例: 15
边线条的颜色数据,指定为逗号分隔的对组,其中包含 'EdgeCData' 和一个长度等于图中边数的向量。EdgeCData 中的值线性映射到当前颜色图中的颜色,导致绘制的图中的每条边具有不同颜色。
边颜色,指定为逗号分隔的对组,其中包含 'EdgeColor' 和下列值之一:
'none'- 不绘制边。'flat'- 每条边的颜色取决于EdgeCData的值。矩阵 - 每行都是一个 RGB 三元组,表示一条边的颜色。矩阵的大小为
numedges(G)×3。RGB 三元组、十六进制颜色代码或颜色名称 - 边使用指定的颜色。
RGB 三元组和十六进制颜色代码对于指定自定义颜色非常有用。
RGB 三元组是包含三个元素的行向量,其元素分别指定颜色中红、绿、蓝分量的强度。强度值必须位于
[0,1]范围内,例如[0.4 0.6 0.7]。十六进制颜色代码是字符向量或字符串标量,以井号 (
#) 开头,后跟三个或六个十六进制数字,范围可以是0到F。这些值不区分大小写。因此,颜色代码"#FF8800"与"#ff8800"、"#F80"与"#f80"是等效的。
此外,还可以按名称指定一些常见的颜色。下表列出了命名颜色选项、等效 RGB 三元组和十六进制颜色代码。
颜色名称 短名称 RGB 三元组 十六进制颜色代码 外观 "red""r"[1 0 0]"#FF0000"
"green""g"[0 1 0]"#00FF00"
"blue""b"[0 0 1]"#0000FF"
"cyan""c"[0 1 1]"#00FFFF"
"magenta""m"[1 0 1]"#FF00FF"
"yellow""y"[1 1 0]"#FFFF00"
"black""k"[0 0 0]"#000000"
"white""w"[1 1 1]"#FFFFFF"
下表列出了浅色和深色主题中绘图的默认调色板。
调色板 调色板颜色 "gem"- 浅色主题默认值在 R2025a 之前的版本中: 大多数绘图默认使用这些颜色。

"glow"- 深色主题默认值
您可以使用
orderedcolors和rgb2hex函数获取这些调色板的 RGB 三元组和十六进制颜色代码。例如,获取"gem"调色板的 RGB 三元组并将其转换为十六进制颜色代码。RGB = orderedcolors("gem"); H = rgb2hex(RGB);在 R2023b 之前的版本中: 使用
RGB = get(groot,"FactoryAxesColorOrder")获取 RGB 三元组。在 R2024a 之前的版本中: 使用
H = compose("#%02X%02X%02X",round(RGB*255))获取十六进制颜色代码。
示例: plot(G,'EdgeColor','r') 创建一个具有红色边的图论图。
边标签,指定为逗号分隔的对组,其中包含 'EdgeLabel' 和一个数值向量、字符向量元胞数组或字符串数组。EdgeLabel 的长度必须等于图中的边数。默认情况下,EdgeLabel 是空元胞数组(不显示边标签)。
示例: {'A', 'B', 'C'}
示例: [1 2 3]
示例: plot(G,'EdgeLabel',G.Edges.Weight) 使用图边的权重作为其标签。
数据类型: single | double | int8 | int16 | int32 | int64 | uint8 | uint16 | uint32 | uint64 | cell | string
图布局方法,指定为逗号分隔的对组,其中包含 'Layout' 和下表中的选项之一。下表还列出了兼容的名称-值对组,可用于进一步优化每一种布局方法。有关这些特定于布局的名称-值对组的详细信息,请参阅 layout 参考页。
| 选项 | 描述 | 特定于布局的名称-值对组 |
|---|---|---|
'auto'(默认值) | 根据图的大小和结构自动选择布局方法。 | — |
'circle' | 圆形布局。将图节点放置在以原点为中心、半径为 1 的圆形上。 |
|
'force' | 力导向图布局 [1]。在相邻节点之间使用引力,在远距离节点之间使用斥力。 |
|
'layered' | 分层节点布局 [2]、[3]、[4]。将图节点置于多层中,表示层级结构。默认情况下是逐层向下的(有向无环图的箭头向下)。 |
|
'subspace' | 子空间嵌入式节点布局 [5]。在高维嵌入式子空间中绘制图节点,然后将位置投影回二维。默认情况下,子空间维度是 100 或节点总数(以两者中较小者为准)。 |
|
'force3' | 三维力导向图布局。 |
|
'subspace3' | 三维子空间嵌入式布局。 |
|
示例: plot(G,'Layout','force3','Iterations',10)
示例: plot(G,'Layout','subspace','Dimension',50)
示例: plot(G,'Layout','layered')
线型,指定为逗号分隔的、由 'LineStyle' 和下表中列出的线型之一组成的对组,或者指定为由此类值构成的元胞数组或字符串向量。指定字符向量元胞数组或字符串向量,以便为每条边使用不同线型。
| 字符 | 线型 | 表示的线条 |
|---|---|---|
'-' | 实线 |
|
'--' | 虚线 |
|
':' | 点线 |
|
'-.' | 点划线 |
|
'none' | 无线条 | 无线条 |
边线宽,指定为逗号分隔的对组,其中包含 'LineWidth' 和一个正值(以磅为单位)或由此类值组成的向量。指定一个向量以对图中的每条边使用不同线宽。
示例: 0.75
节点标记符号,指定为逗号分隔的、由 'Marker' 和下表中列出的字符向量之一组成的对组,或者指定为由此类值构成的元胞数组或字符串向量。默认为对图节点使用圆形标记。指定字符向量元胞数组或字符串向量,以便为每个节点使用不同标记。
| 标记 | 描述 | 生成的标记 |
|---|---|---|
"o" | 圆圈 |
|
"+" | 加号 |
|
"*" | 星号 |
|
"." | 点 |
|
"x" | 叉号 |
|
"_" | 水平线条 |
|
"|" | 垂直线条 |
|
"square" | 方形 |
|
"diamond" | 菱形 |
|
"^" | 上三角 |
|
"v" | 下三角 |
|
">" | 右三角 |
|
"<" | 左三角 |
|
"pentagram" | 五角形 |
|
"hexagram" | 六角形 |
|
"none" | 无标记 | 不适用 |
示例: '+'
示例: 'diamond'
节点标记大小,指定为逗号分隔的对组,其中包含 'MarkerSize' 和一个正值(以磅为单位)或由此类值组成的向量。指定一个向量以对图中的每个节点使用不同标记大小。对于具有 100 个或更少节点的图,MarkerSize 的默认值是 4,对于超过 100 个节点的图,默认值是 2。
示例: 10
节点标记的颜色数据,指定为逗号分隔的对组,其中包含 'NodeCData' 和一个长度等于图中节点数的向量。NodeCData 中的值线性映射到当前颜色图中的颜色,使得绘制的图中的每个节点具有不同颜色。
节点颜色,指定为逗号分隔的对组,其中包含 'NodeColor' 和下列值之一:
'none'- 不绘制节点。'flat'- 每个节点的颜色取决于NodeCData的值。矩阵 - 每行都是一个 RGB 三元组,表示一个节点的颜色。矩阵的大小为
numnodes(G)×3。RGB 三元组、十六进制颜色代码或颜色名称 - 节点使用指定的颜色。
RGB 三元组和十六进制颜色代码对于指定自定义颜色非常有用。
RGB 三元组是包含三个元素的行向量,其元素分别指定颜色中红、绿、蓝分量的强度。强度值必须位于
[0,1]范围内,例如[0.4 0.6 0.7]。十六进制颜色代码是字符向量或字符串标量,以井号 (
#) 开头,后跟三个或六个十六进制数字,范围可以是0到F。这些值不区分大小写。因此,颜色代码"#FF8800"与"#ff8800"、"#F80"与"#f80"是等效的。
此外,还可以按名称指定一些常见的颜色。下表列出了命名颜色选项、等效 RGB 三元组和十六进制颜色代码。
颜色名称 短名称 RGB 三元组 十六进制颜色代码 外观 "red""r"[1 0 0]"#FF0000""green""g"[0 1 0]"#00FF00""blue""b"[0 0 1]"#0000FF""cyan""c"[0 1 1]"#00FFFF""magenta""m"[1 0 1]"#FF00FF""yellow""y"[1 1 0]"#FFFF00""black""k"[0 0 0]"#000000""white""w"[1 1 1]"#FFFFFF"下表列出了浅色和深色主题中绘图的默认调色板。
调色板 调色板颜色 "gem"- 浅色主题默认值在 R2025a 之前的版本中: 大多数绘图默认使用这些颜色。
"glow"- 深色主题默认值您可以使用
orderedcolors和rgb2hex函数获取这些调色板的 RGB 三元组和十六进制颜色代码。例如,获取"gem"调色板的 RGB 三元组并将其转换为十六进制颜色代码。RGB = orderedcolors("gem"); H = rgb2hex(RGB);在 R2023b 之前的版本中: 使用
RGB = get(groot,"FactoryAxesColorOrder")获取 RGB 三元组。在 R2024a 之前的版本中: 使用
H = compose("#%02X%02X%02X",round(RGB*255))获取十六进制颜色代码。
示例: plot(G,'NodeColor','k') 创建一个具有黑色节点的图论图。
节点标签,指定为逗号分隔的对组,其中包含 'NodeLabel' 和一个数值向量、字符向量元胞数组或字符串数组。NodeLabel 的长度必须等于图中的节点数。默认情况下,NodeLabel 是包含图节点的节点 ID 的元胞数组:
对于不带名称的节点(即
G.Nodes不包含Name变量),节点标签是元胞数组中包含的值unique(G.Edges.EndNodes)。对于具有名称的节点,节点标签是
G.Nodes.Name'。
示例: {'A', 'B', 'C'}
示例: [1 2 3]
示例: plot(G,'NodeLabel',G.Nodes.Name) 将节点名称作为其标签。
数据类型: single | double | int8 | int16 | int32 | int64 | uint8 | uint16 | uint32 | uint64 | cell | string
注意
XData 和 YData 必须同时指定,以使每个节点具有一个有效的 (x,y) 坐标。您还可以选择为三维坐标指定 ZData。
节点的 x 坐标,指定为逗号分隔的对组,其中包含 'XData' 和一个长度等于图中节点数的向量。
注意
XData 和 YData 必须同时指定,以使每个节点具有一个有效的 (x,y) 坐标。您还可以选择为三维坐标指定 ZData。
节点的 y 坐标,指定为逗号分隔的对组,其中包含 'YData' 和一个长度等于图中节点数的向量。
注意
XData 和 YData 必须同时指定,以使每个节点具有一个有效的 (x,y) 坐标。您还可以选择为三维坐标指定 ZData。
节点的 z 坐标,指定为逗号分隔的对组,其中包含 'ZData' 和一个长度等于图形中节点数的向量。
输出参量
参考
[1] Fruchterman, T., and E. Reingold. “Graph Drawing by Force-directed Placement.” Software — Practice & Experience. Vol. 21 (11), 1991, pp. 1129–1164.
[2] Gansner, E., E. Koutsofios, S. North, and K.-P Vo. “A Technique for Drawing Directed Graphs.” IEEE Transactions on Software Engineering. Vol.19, 1993, pp. 214–230.
[3] Barth, W., M. Juenger, and P. Mutzel. “Simple and Efficient Bilayer Cross Counting.” Journal of Graph Algorithms and Applications. Vol.8 (2), 2004, pp. 179–194.
[4] Brandes, U., and B. Koepf. “Fast and Simple Horizontal Coordinate Assignment.” LNCS. Vol. 2265, 2002, pp. 31–44.
[5] Y. Koren. “Drawing Graphs by Eigenvectors: Theory and Practice.” Computers and Mathematics with Applications. Vol. 49, 2005, pp. 1867–1888.