GraphPlot
有向图和无向图的图论图
说明
图论图是以可视化形式呈现使用 graph 和 digraph 函数创建的图和网络的主要方法。创建 GraphPlot 对象后,可以通过更改其属性值修改该绘图的各个方面。这对于修改图节点或边的显示特别有用。
创建对象
要创建 GraphPlot 对象,请指定一个输出参量和 plot 函数。例如:
G = graph([1 1 1 1 5 5 5 5],[2 3 4 5 6 7 8 9]);
h = plot(G)
属性
| GraphPlot 属性 | 图论图的外观和行为 |
示例
创建一个 GraphPlot 对象,然后说明如何调整该对象的属性来影响输出显示。
创建并绘制一个图。
s = [1 1 1 1 1 1 1 9 9 9 9 9 9 9];
t = [2 3 4 5 6 7 8 2 3 4 5 6 7 8];
G = graph(s,t);
h = plot(G)

h =
  GraphPlot with properties:

     NodeColor: [0.0660 0.4430 0.7450]
    MarkerSize: 4
        Marker: 'o'
     EdgeColor: [0.0660 0.4430 0.7450]
     LineWidth: 0.5000
     LineStyle: '-'
     NodeLabel: {'1'  '2'  '3'  '4'  '5'  '6'  '7'  '8'  '9'}
     EdgeLabel: {}
         XData: [0.2900 -1.2416 0.3508 -2.1954 2.0002 0.5960 1.9160 -1.4265 -0.2896]
         YData: [-0.0951 1.7903 -2.1635 0.0907 0.8844 2.1102 -1.0584 -1.6556 0.0971]
         ZData: [0 0 0 0 0 0 0 0 0]

  Show all properties
对图节点使用自定义节点坐标。
h.XData = [0 -3 -2 -1 0 1 2 3 0];
h.YData = [2 0 0 0 0 0 0 0 -2];

将图节点设置为红色。
h.NodeColor = 'r';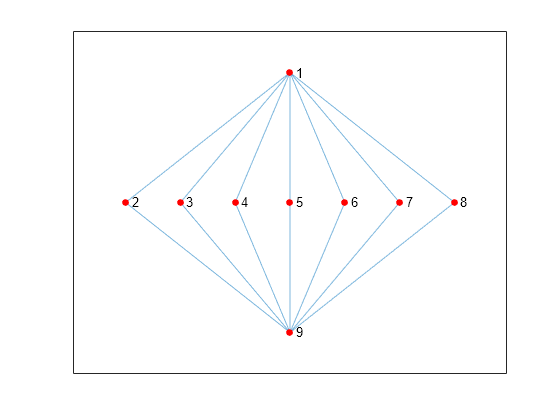
对图边使用虚线。
h.LineStyle = '--';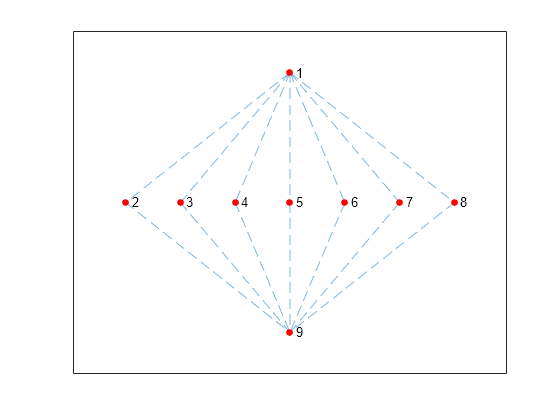
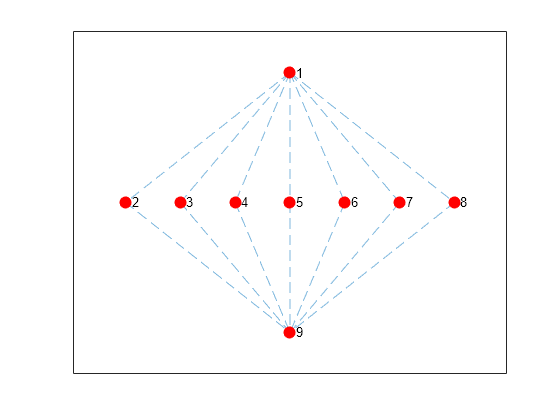
增加节点的大小。
h.MarkerSize = 8;
使用 savefig 函数保存图的图论图图窗。
s = [1 1 1 2 2 3 3 4 5 5 6 7];
t = [2 4 5 3 6 4 7 8 6 8 7 8];
G = graph(s,t);
plot(G);
savefig('cubegraph.fig');
clear s t G
close gcf
使用 openfig 重新将图的图论图图窗加载到 MATLAB® 中。openfig 还返回图窗的句柄 y。
y = openfig('cubegraph.fig');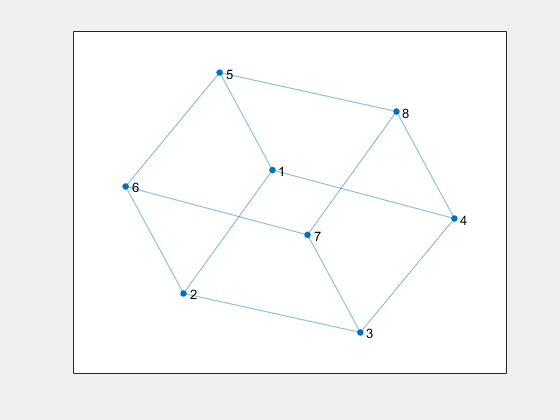
使用 findobj 函数利用一个属性值找到正确的对象句柄。通过使用 findobj,您可以继续操作用于生成图窗的原始 GraphPlot 对象。
h = findobj('Marker','o')
h =
  GraphPlot with properties:

     NodeColor: [0.0660 0.4430 0.7450]
    MarkerSize: 4
        Marker: 'o'
     EdgeColor: [0.0660 0.4430 0.7450]
     LineWidth: 0.5000
     LineStyle: '-'
     NodeLabel: {'1'  '2'  '3'  '4'  '5'  '6'  '7'  '8'}
     EdgeLabel: {}
         XData: [-0.0495 -0.0119 -1.5285 -1.5694 1.5285 1.5694 0.0495 0.0119]
         YData: [-2.0789 -0.5215 0.8917 -0.8184 -0.8917 0.8184 2.0789 0.5215]
         ZData: [0 0 0 0 0 0 0 0]

  Show all properties