stepinfo
上升时间、稳定时间和其他阶跃响应特征
语法
说明
stepinfo 可用于计算动态系统模型或阶跃响应数据数组的阶跃响应特征。对于阶跃响应 y (t),stepinfo 计算相对于 yinit 和 yfinal 的特征,其中 yinit 是初始偏移量(即施加阶跃之前的值),yfinal 是响应的稳态值。这些值取决于您使用的语法。
对于动态系统模型
sys,stepinfo使用 yinit = 0 且 yfinal = 稳态值。对于阶跃响应数据数组
[y,t],stepinfo使用 yinit = 0 且 yfinal =y的最后一个采样值,除非您显式指定这些值。
有关 stepinfo 如何计算阶跃响应特征的详细信息,请参阅算法。
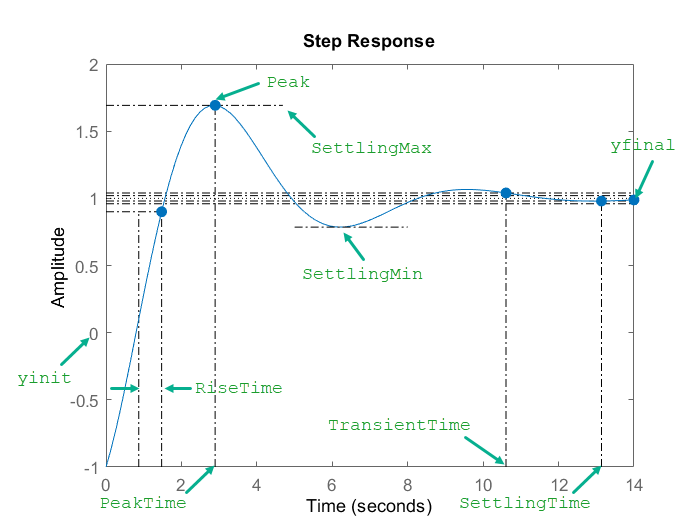
下图说明了 stepinfo 为阶跃响应计算的一些特征。对于此响应,假设当 t < 0 时,y (t) = 0,因此 yinit = 0。
示例
计算动态系统模型的阶跃响应特征,例如上升时间、稳定时间和超调。对于此示例,请使用连续时间传递函数:
.
创建传递函数并检查其阶跃响应。
sys = tf([1 5 5],[1 1.65 5 6.5 2]);
step(sys)
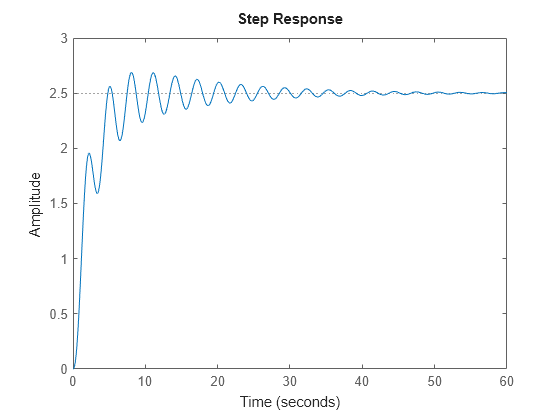
该图显示响应在几秒钟内上升,然后逐渐衰减到约为 2.5 的稳态值。使用 stepinfo 计算此响应的特征。
S = stepinfo(sys)
S = struct with fields:
         RiseTime: 3.8456
    TransientTime: 27.9762
     SettlingTime: 27.9762
      SettlingMin: 2.0689
      SettlingMax: 2.6873
        Overshoot: 7.4915
       Undershoot: 0
             Peak: 2.6873
         PeakTime: 8.0530
其中,该函数使用 = 0 来计算动态系统模型 sys 的特征。
默认情况下,稳定时间是误差保持在 的 2% 以下所需的时间。结果 S.SettlingTime 显示,对于 sys,此情况发生在约 28 秒之后。上升时间的默认定义是响应从 = 0 到 变化区间的 10% 升到 90% 所需的时间。S.RiseTime 显示,对于 sys,此上升发生在不到 4 秒的时间内。最大超调在 S.Overshoot 中返回。对于该系统,峰值 S.Peak 的出现时间为 S.PeakTime,其超调量约为稳态值的 7.5%。
对于 MIMO 系统,stepinfo 返回一个结构体数组,其中每个条目包含系统相应 I/O 通道的响应特征。对于此示例,请使用一个双输出、双输入的离散时间系统。计算阶跃响应特征。
A = [0.68 -0.34; 0.34 0.68];
B = [0.18 -0.05; 0.04 0.11];
C = [0 -1.53; -1.12 -1.10];
D = [0 0; 0.06 -0.37];
sys = ss(A,B,C,D,0.2);

S = stepinfo(sys)
S=2×2 struct array with fields:
    RiseTime
    TransientTime
    SettlingTime
    SettlingMin
    SettlingMax
    Overshoot
    Undershoot
    Peak
    PeakTime
通过对 S 进行索引来访问特定 I/O 通道的响应特征。例如,检查 sys 的第一个输入到第二个输出的响应特征,对应于 S(2,1)。
S(2,1)
ans = struct with fields:
         RiseTime: 0.4000
    TransientTime: 2.8000
     SettlingTime: 3
      SettlingMin: -0.6724
      SettlingMax: -0.5188
        Overshoot: 24.6476
       Undershoot: 11.1224
             Peak: 0.6724
         PeakTime: 1
要访问特定值,请使用圆点表示法。例如,提取 (2,1) 通道的上升时间。
rt21 = S(2,1).RiseTime
rt21 =
0.4000
您可以使用 SettlingTimeThreshold 和 RiseTimeThreshold 分别更改稳定时间和上升时间的默认百分比,如算法部分所述。对于此示例,请使用以下系统:
.
创建传递函数。
sys = tf([1 5 5],[1 1.65 5 6.5 2]);
计算 sys 的响应误差保持在差距 的 0.5% 以下所需的时间。为此,请将 SettlingTimeThreshold 设置为 0.5%(即 0.005)。
S1 = stepinfo(sys,SettlingTimeThreshold=0.005);
st1 = S1.SettlingTime
st1 =
46.1325
计算 sys 的响应从 到 变化区间的 5% 升到 95% 所需的时间。为此,请将 RiseTimeThreshold 设置为包含这些边界的向量。
S2 = stepinfo(sys,RiseTimeThreshold=[0.05 0.95]);
rt2 = S2.RiseTime
rt2 =
4.1690
您可以在同一计算中同时定义稳定时间和上升时间的百分比。
S3 = stepinfo(sys,...
    SettlingTimeThreshold=0.005, ...
    RiseTimeThreshold=[0.05 0.95])
S3 = struct with fields:
         RiseTime: 4.1690
    TransientTime: 46.1325
     SettlingTime: 46.1325
      SettlingMin: 2.0689
      SettlingMax: 2.6873
        Overshoot: 7.4915
       Undershoot: 0
             Peak: 2.6873
         PeakTime: 8.0530
即使没有系统模型,您也可以从阶跃响应数据中提取阶跃响应特征。例如,假设您已经测量了您的系统对阶跃输入的响应,并将得到的响应数据保存在一个响应值向量 y 中,与这些响应值对应的时间存储在另一个向量 t 中。加载响应数据并对其进行检查。
load StepInfoData t y
plot(t,y)
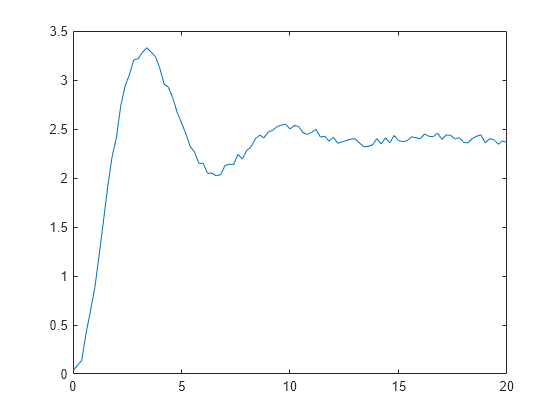
使用 stepinfo 根据此响应数据计算阶跃响应特征。如果您未指定稳态响应值 yfinal,则 stepinfo 会假定响应向量 y 中的最后一个值是稳态响应。由于数据中存在一些噪声,y 中的最后一个值可能不是真正的稳态响应值。当您知道稳态值应为多少时,即可将其提供给 stepinfo。例如,在此示例中,假设稳态响应为 2.4。
S1 = stepinfo(y,t,2.4)
S1 = struct with fields:
         RiseTime: 1.2897
    TransientTime: 19.6478
     SettlingTime: 19.6439
      SettlingMin: 2.0219
      SettlingMax: 3.3302
        Overshoot: 38.7575
       Undershoot: 0
             Peak: 3.3302
         PeakTime: 3.4000
由于数据中存在噪声,默认的稳定时间定义过于严格,导致得到近乎 20 秒的任意值。为了考虑噪声的影响,请将稳定时间阈值从默认的 2% 提高到 5%。
S2 = stepinfo(y,t,2.4,'SettlingTimeThreshold',0.05)S2 = struct with fields:
RiseTime: 1.2897
TransientTime: 10.4201
SettlingTime: 10.4149
SettlingMin: 2.0219
SettlingMax: 3.3302
Overshoot: 38.7575
Undershoot: 0
Peak: 3.3302
PeakTime: 3.4000
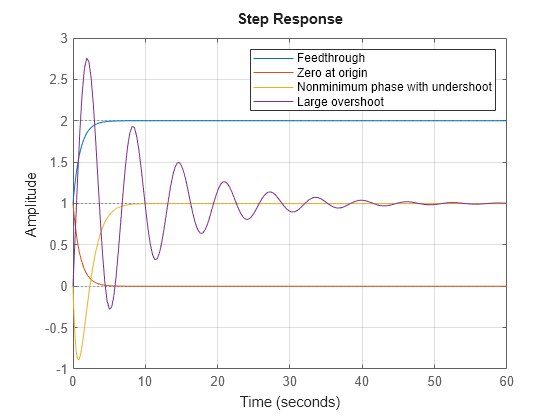
当峰值误差 等于差距 (请参阅算法 (Control System Toolbox))时,稳定时间和瞬态时间是相等的。这种情况适用于无欠调或馈通且超调小于 100% 的模型。对于具有馈通、零点位于原点、具有不稳定零点(欠调)或大超调的模型,稳定时间和瞬态时间往往存在区别。
假设有以下模型。
sys1- 具有直接馈通的系统sys2- 零点位于原点的系统sys3- 具有欠调的非最小相位系统sys4- 具有大超调的系统
s = tf("s");
sys1 = 1+tf(1,[1 1]);
sys2 = tf([1 0],[1 1]);
sys3 = tf([-3 1],[1 2 1]);
sys4 = (s/0.5 + 1)/(s^2 + 0.2*s + 1);

step(sys1,sys2,sys3,sys4)
grid on
legend("Feedthrough", ...
    "Zero at origin", ...
    "Nonminimum phase with undershoot", ...
    "Large overshoot")
计算阶跃响应特征。
S1 = stepinfo(sys1)
S1 = struct with fields:
         RiseTime: 1.6095
    TransientTime: 3.9121
     SettlingTime: 3.2190
      SettlingMin: 1.8005
      SettlingMax: 1.9993
        Overshoot: 0
       Undershoot: 0
             Peak: 1.9993
         PeakTime: 7.3222
S2 = stepinfo(sys2)
S2 = struct with fields:
         RiseTime: 0
    TransientTime: 3.9121
     SettlingTime: NaN
      SettlingMin: 6.6069e-04
      SettlingMax: 1
        Overshoot: Inf
       Undershoot: Inf
             Peak: 1
         PeakTime: 0
S3 = stepinfo(sys3)
S3 = struct with fields:
         RiseTime: 2.9198
    TransientTime: 6.5840
     SettlingTime: 7.3229
      SettlingMin: 0.9008
      SettlingMax: 1.0000
        Overshoot: 0
       Undershoot: 88.9301
             Peak: 1.0000
         PeakTime: 14.6905
S4 = stepinfo(sys4)
S4 = struct with fields:
         RiseTime: 0.3896
    TransientTime: 40.3317
     SettlingTime: 46.5052
      SettlingMin: -0.2796
      SettlingMax: 2.7571
        Overshoot: 175.7137
       Undershoot: 27.9629
             Peak: 2.7571
         PeakTime: 1.8850
检查绘图和特征。对于这些模型,稳定时间和瞬态时间不同,因为峰值误差超过了初始值和最终值之间的差距。对于诸如 sys2 之类的模型,由于稳态值为零,稳定时间返回为 NaN。
在此示例中,您将根据具有初始偏移量的阶跃响应数据计算阶跃响应特征。这意味着在阶跃发生之前,响应数据的值不为零。
加载阶跃响应数据并检查绘图。
load stepDataOffset.mat
plot(stepOffset.Time,stepOffset.Data)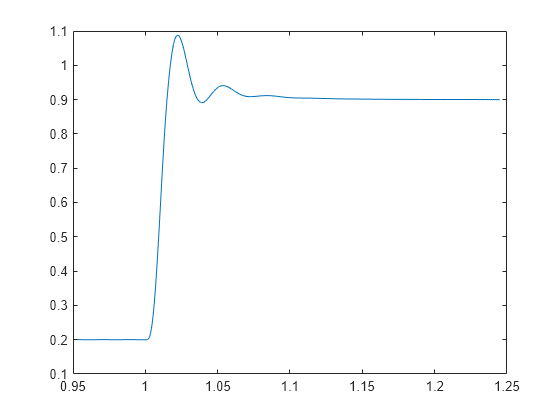
如果您未指定 yfinal 和 yinit,则 stepinfo 会假定 yfinal 是响应向量 y 中的最后一个值,而 yinit 为零。当您知道稳态值和初始值是多少时,可以将它们提供给 stepinfo。其中,响应 yfinal 的稳态值为 0.9,初始偏移量 yinit 为 0.2。
根据此响应数据计算阶跃响应特征。
S = stepinfo(stepOffset.Data,stepOffset.Time,0.9,0.2)
S = struct with fields:
         RiseTime: 0.0084
    TransientTime: 1.0662
     SettlingTime: 1.0662
      SettlingMin: 0.8461
      SettlingMax: 1.0878
        Overshoot: 26.8259
       Undershoot: 0.0429
             Peak: 0.8878
         PeakTime: 1.0225
其中,该响应的峰值为 0.8878,因为 stepinfo 测量的是与 yinit 的最大偏差。
输入参数
动态系统,指定为 SISO 或 MIMO 动态系统模型。您可以使用的动态系统包括:
阶跃响应数据,指定为以下项之一:
对于 SISO 响应数据,为长度为
Ns的向量,其中Ns是响应数据中的采样数对于 MIMO 响应数据,为
Ns×Ny×Nu的数组,其中Ny是系统输出的数量,Nu是系统输入的数量
您可以使用 y 指定复数响应数据。 (自 R2025a 起)
与 y 中的响应数据对应的时间向量,指定为长度为 Ns 的向量。
阶跃发生之前 y 的值,指定为标量或数组。
对于 SISO 响应数据,请指定一个标量值。
对于 MIMO 响应数据,请指定一个
Ny×Nu的数组,其中每个条目提供相应系统通道的响应初始值。
您可以使用 yinit 指定复数初始值。 (自 R2025a 起)
如果您未提供 yinit,则 stepinfo 将使用零作为响应初始值。
对于无馈通的系统,t = 0 时的响应 y (0) 等于 yinit。但是,在存在馈通的情况下,由于 t = 0 处的不连续性,这两个量不同。
例如,下图显示了具有馈通的系统 sys = tf([-1 0.2 1],[1 0.7 1]) 的阶跃响应。
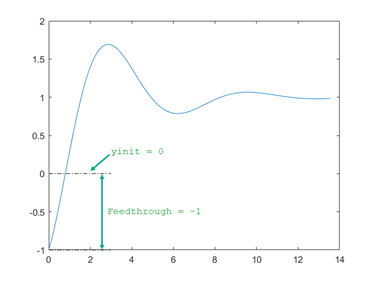
其中,yinit 为零,馈通值为 -1。
仅当您提供阶跃响应数据作为输入时,才支持此参量。如果使用动态系统模型 sys 作为输入,stepinfo 将使用 yinit = 0 来计算依赖于该值的特征。
用于定义稳定时间和瞬态时间的阈值,指定为 0 到 1 之间的标量值。要更改默认的稳定时间和瞬态时间定义(请参阅算法),请将 ST 设置为其他值。例如,要测量误差何时低于 5%,请将 ST 设置为 0.05。
用于定义上升时间的阈值,指定为一个 2 元素行向量,元素为 0 到 1 之间的非降序值。要更改默认的上升时间定义(请参阅算法),请将 RT 设置为其他值。例如,要将上升时间定义为响应从初始值到稳态值期间从 5% 上升到 95% 所需的时间,请将 RT 设置为 [0.05 0.95]。
输出参量
算法
对于阶跃响应 y (t),stepinfo 计算相对于 yinit 和 yfinal 的特征。默认情况下,对于动态系统模型 sys,stepinfo 使用 yinit = 0 且 yfinal = 稳态值。
下表显示了 stepinfo 如何计算每个特征。
| 阶跃响应特征 | 描述 |
|---|---|
RiseTime | 响应从 yinit 到 yfinal 变化区间的 10% 升到 90% 所需的时间 |
TransientTime | 当 t ≥ T 时,第一个使得误差 |y (t) - yfinal| ≤ SettlingTimeThreshold × emax 的时间 T,其中 emax 是 t ≥ 0 时的最大误差 |y (t) - yfinal|。 默认情况下,SettlingTimeThreshold = 0.02(峰值误差的 2%)。瞬态时间衡量瞬态动态特性消失的速度。 |
SettlingTime | 当 t ≥ T 时,第一个使得误差 |y (t) - yfinal| ≤ SettlingTimeThreshold × |yfinal - yinit| 的时间 T。 默认情况下, |
SettlingMin | 响应上升后 y (t) 的最小值 |
SettlingMax | 响应上升后 y (t) 的最大值 |
Overshoot | 超调百分比。相对于归一化响应 ynorm (t) = (y(t) – yinit)/(yfinal – yinit),超调为零和 100 × max(ynorm(t) – 1) 中的较大者。 |
Undershoot | 欠调百分比。相对于归一化响应 ynorm(t),欠调为零和 –100 × min(ynorm(t) ) 中的较小者。 |
Peak | |y (t) - yinit| 的峰值 |
PeakTime | 峰值出现的时间 |
对于复数响应,stepinfo 通过将 y (t) 投影到从 yinit 到 yfinal 所连成的射线上计算 RiseTime、Overshoot 和 Undershoot。复数响应的所有其他特征与上表中的定义相同,并基于 y、yinit 和 yfinal 中复数值的模进行计算。下图显示了投影到从 yinit 到 yfinal 的射线上的 10% 和 90% 上升时间点。 (自 R2025a 起)
