在基于 axesm 的地图上绘制数据
R2026b在基于 axesm 的地图上以地理坐标显示数据,并在笛卡尔坐标区上以平面坐标显示数据。创建点图、线图和多边形图、等高线图和栅格绘图。
作为二维 axesm 地图的替代方案是地理坐标区和地图坐标区,它们可用于许多任务,包括探索、出版和 App 构建。有关可以使用 Mapping Toolbox™ 软件创建的二维地图显示的比较,请参阅选择二维地图显示。
函数
主题
- Display Vector Data as Points and Lines
Display vector data using discrete points, and connect the points with a great circle track and a rhumb line track.
- Display Vector Data as Lines and Patches
Display vector data using connected line segments and closed polygons.
- Create Choropleth Map of Population Density
Create a choropleth map of US population density, where the color of each state represents the population density of the state.
- Fit Gridded Data to Graticule
A graticule is a grid of meridians and parallels that guides the placement of features on a map. A finer graticule provides greater precision and requires more effort and time.
精选示例
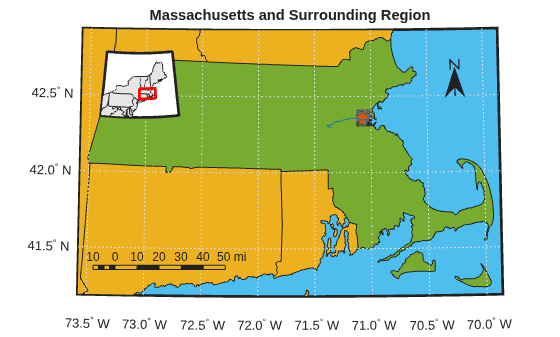
Create Map Displays with Geographic Data
Import geographic data with coordinates in latitude and longitude, display geographic data in a map display, and customize the display.
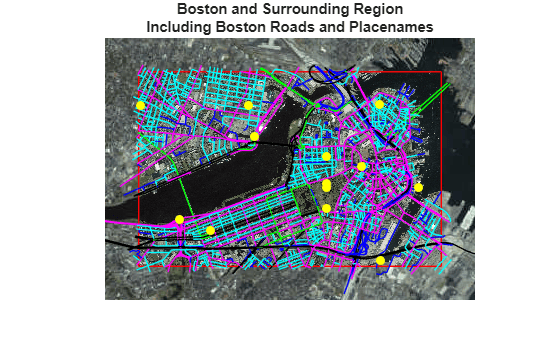
Create Maps with Data in Projected Coordinate Reference Systems
Create a map using multiple data sets with coordinates in geographic and projected coordinate reference systems.

