Share Analysis
Copy Displays
You can share the plots that you have produced using the Signal Analyzer app by copying one or more displays to the clipboard as images and pasting them into another application.
To copy displays to the clipboard, on the Display tab, click Copy All Displays ▼. You can then copy either the selected display or the complete display layout.
To copy a single display to the clipboard, you can also right-click the display and select Copy Display.
Export Signals
You can export any signals in the Signal Analyzer Signal table to the MATLAB® workspace or to a MAT file.
To export signals:
Select one or more signals from the Signal table.
On the Analyzer tab, click Export.
Choose whether you want to export the selected signals to the MATLAB workspace or save them to a MAT file. If you choose to save the signals, browse to where you want to save the file, name the file, and click Save.
You can also select the signals, right-click, and select Export.
Signals are exported differently, depending on their type:
Signals with no time information are exported or saved as numeric vectors.
Signals stored as timetables are exported or saved as timetables.
Signals that have time information but are not stored as timetables are exported or saved as numeric vectors. If you want to preserve the time information, you can save the signals as timetables. On the Analyzer tab, click Preferences and check
Always use timetables when signals have time information.The export behavior for multichannel signals depends on the signals and channels that you select and on the preferences you have set.
Whenever possible, the app exports signals of the same name and type (numeric or timetable) as the originals.
If you select a signal with several channels, the app exports it as a single matrix or timetable if the individual channels have the same length and time information.
If you select a signal with several channels that have different lengths or different time information, the app exports them as independent signals.
If you select a signal and one or more of its channels at the same time, the app exports a copy of the whole signal and independent variables corresponding to the selected channels.
Example: Create three two-channel signals. Each channel of
sgnhas 100 samples. Each channel ofsgthas 200 samples. The timetabletmbhas two 20-sample channels sampled at 1 Hz.Drag the signals to the Signal table. Expand the tree view to see the individual channels. Selectsgn = randn(100,2); sgt = randn(200,2); tmb = timetable(seconds(0:19)',randn(20,2));
sgtand, on the Analyzer tab, click Time Values. SelectSample Rate and Start Timeand specify a sample rate of 25 Hz. Selectsgn, the first channel ofsgt, and the second channel of the only variable oftmb.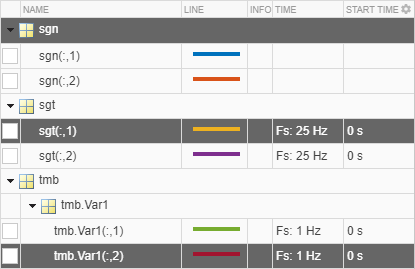
On the Analyzer tab, click Export to export the selected signals to a MAT file. Use the default file name. Load the file into the MATLAB workspace.
load New_Export whosThe app exportedName Size Bytes Class sgn 100x2 1600 double sgt_1 200x1 1600 double tmb_Var1_2 20x1 1368 timetable
sgt_1as a vector, even though it has time information. On the Analyzer tab, click Preferences and checkAlways use timetables when signals have time information. Export the signals again.sgt_1becomes a timetable.Example: Create a timetable with four variables.
"Temperature"has two channels,"WindSpeed"has one channel,"Electric"has three channels, and"Magnetic"has one channel.Drag the timetable to the Signal table. Expand the tree view to see the individual channels. Selecttmt = timetable(seconds(0:99)', ... randn(100,2),randn(100,1),randn(100,3),randn(100,1)); tmt.Properties.VariableNames = ... ["Temperature" "WindSpeed" "Electric" "Magnetic"];
tmt,tmt.Temperature, the second channel oftmt.Electric, andtmt.Magnetic.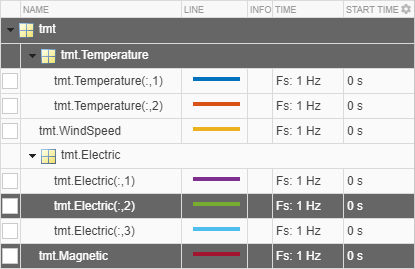
On the Analyzer tab, click Export to export the selected signals to a MAT file. Use the default file name. Load the file into the MATLAB workspace.
load New_Export whosThe app exportedName Size Bytes Class tmt 100x4 8180 timetable tmt_Electric_2 100x1 2656 timetable tmt_Magnetic 100x1 2652 timetable tmt_Temperature 100x1 3458 timetable
tmtas a four-variable timetable,tmt_Temperatureas a timetable with a two-channel variable, and the two single-variable, single-channel timetablestmt_Electric_2andtmt_Magnetic.
Generate MATLAB Scripts and Functions
You can generate MATLAB scripts to extract signal regions of interest or automate the computation of spectrum, persistence spectrum, spectrogram, or scalogram estimates obtained with the Signal Analyzer app.
To generate a MATLAB script, on the Display tab, click Generate Script. The generated script opens in the Editor.
Select
ROI Script Between Time Limitsto generate a MATLAB script that extracts a region of interest defined by the time limits of the selected display. Depending on the preferences, the regions of interest are saved as numeric vectors or as a timetable.Select
ROI Script Between Time Cursorsto generate a MATLAB script that extracts a region of interest defined by the locations of the time-domain cursors in the selected display. Depending on the preferences, the regions of interest are saved as numeric vectors or as a timetable.Select
Spectrum Scriptto generate a MATLAB script that computes the power spectrum appearing in the spectrum view of the selected display.Select
Persistence Spectrum Scriptto generate a MATLAB script that computes the persistence spectrum appearing in the spectrum view of the selected display.Select
Spectrogram Scriptto generate a MATLAB script that computes the spectrogram appearing in the spectrogram view of the selected display.Select
Scalogram Scriptto generate a MATLAB script that computes the scalogram appearing in the scalogram view of the selected display. You need a Wavelet Toolbox™ license to use the scalogram view.
You can generate MATLAB functions to automate signal preprocessing steps performed with the Signal Analyzer app.
To generate a MATLAB preprocessing function, on the Analyzer tab, click Generate Function. The generated function opens in the Editor.
Save and Load Signal Analyzer Sessions
If you want to share session snapshots or archive them to view later, save the Signal Analyzer session to a MAT file or MLDATX file. Using MLDATX files results in faster save and load times.
To save a session to a MAT file or MLDATX file:
On the Analyzer tab, click Save ▼ and select
Save.Browse to where you want to save the file, name the file, choose the format, and click Save.
If you want to update the file, click Save. If you want to save the
session to a different file, click Save ▼ and select Save
as.
To load a saved session:
On the Analyzer tab, click Open.
Browse to the MAT file or MLDATX file saved from a previous session, select it, and click Open. The signal data and properties appear as they were when the file was last saved.
To start a new session, on the Analyzer tab, click New.