Preprocess Signals
You can preprocess signals in the Signal Analyzer app with various functions and actions including filtering, cropping, and clipping. From the main Analyzer tab, you can enter the preprocessing mode, undo any previous preprocessing, and generate MATLAB® code for any selected signals in the Signal table. To enter the preprocessing mode, select one or more signals in the Signal table and click Preprocess.
You can perform preprocessing operations any number of times and in any order. The
Info column in the Signal table includes an icon
![]() that indicates if any preprocessing has been performed on a
signal. Clicking the icon enumerates the actions and the order in which they were performed.
Preprocessing steps can be undone by clicking Undo Preprocessing in the
mode or on the Analyzer tab. The app undoes the steps one at a time,
starting with the most recent. To see a full summary of the preprocessing steps you took,
including all settings you chose, click Generate Function on the
Analyzer tab.
that indicates if any preprocessing has been performed on a
signal. Clicking the icon enumerates the actions and the order in which they were performed.
Preprocessing steps can be undone by clicking Undo Preprocessing in the
mode or on the Analyzer tab. The app undoes the steps one at a time,
starting with the most recent. To see a full summary of the preprocessing steps you took,
including all settings you chose, click Generate Function on the
Analyzer tab.
Note
Preprocessing operations overwrite the signal on which they work. If you want to keep the original signal, duplicate it and operate on the duplicate.
You can preprocess individual channels of a multichannel signal. If you select a multichannel signal and one of its channels for preprocessing, the app preprocesses the individual channel only once.
Importing signals into Signal Analyzer is not supported when the preprocessing mode is active.
Display
All signals selected before entering the preprocessing mode are added to the Signal table inside the mode when you click Preprocess. The app plots the first signal in the display. To plot additional signals, select the signals in the Signal table. You can specify a maximum number of signals to plot by modifying the value for Maximum Signals. If you specify a maximum number of signals less than the number of signals in the Signal table, the preprocessing actions are still applied to all signals selected in the Signal table inside the mode.
To change the line color of a signal, click the colorbar in the Line column of the Signal table and select a color. You can choose a standard color or specify a custom color using RGB values. Click OK.
Tip
To aid signal preprocessing, you can activate the panner, use a zoom action, or add a spectrum, spectrogram, or scalogram view to the display.
Delete, Duplicate, and Rename Signals
Signal Analyzer enables you to delete, duplicate, and rename signals in the preprocessing mode.
To delete a signal, select the signal in the Signal table and hit the Del key on your keyboard. Alternatively, right-click the signal in the Signal table and select Delete. Confirm the deletion in the Delete pop-up window. If you delete signals in the preprocessing mode and save your preprocessing steps by selecting Accept All, the signals are also deleted in the main app. If you discard your preprocessing steps by selecting Cancel, the signals are preserved in the main app.
To duplicate a signal, click Duplicate in the
Preprocess tab or right-click the signal in the Signal table and
select Duplicate. The duplicate has the same name as the original
signal with _Copy appended. If you duplicate signals in the
preprocessing mode and save your preprocessing steps by selecting Accept
All, the duplicate signals appear in the main app. If you discard your
preprocessing steps by selecting Cancel, the duplicate signals do
not appear in the main app.
To rename a signal, double-click the signal name in the Signal table and change the name. Alternatively, right-click the signal in the Signal table and select Rename. Click outside the text box or hit the Enter key on your keyboard to save the change.
Note
You cannot rename individual channels of a multichannel signal.
Preprocessing Functions
Filter Signals
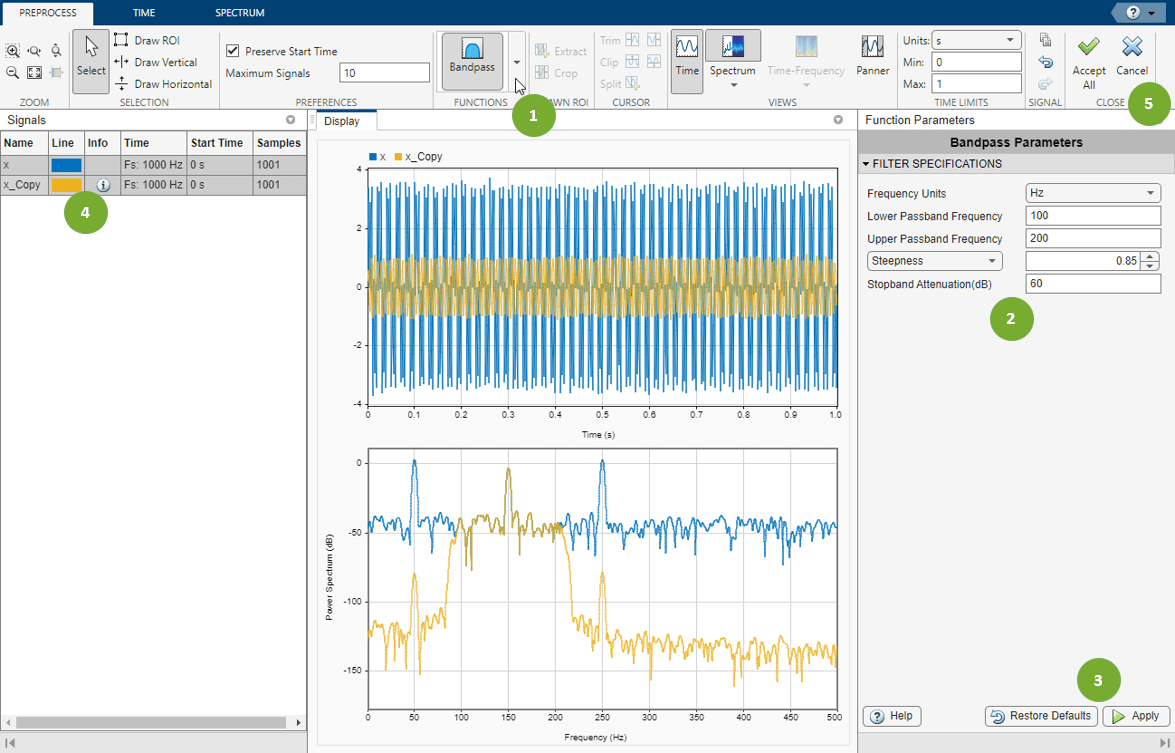
To filter one or more selected signals:
Select a filter from the Functions gallery.
Adjust filter specifications in the Function Parameters panel, including stopband attenuation, passband frequencies, steepness, and widths of the transition regions.
Click Apply to apply the filter, or click Restore Defaults to restore the default settings.
In the Info column, click the icon to view the preprocessing history.
Click Accept All to save the preprocessing results, or click Cancel to discard the changes.
The app uses these functions to perform the filtering:
Note
Filtering does not support nonuniformly sampled signals.
Fill Missing Data; Denoise, Detrend, or Smooth Signals
To fill missing data, denoise, detrend, or smooth one or more selected signals, expand the Functions gallery and select an option from the Clean list.
Fill Missing Data (since R2024a) — To find and fill missing data, the app uses the MATLAB function
fillmissing. The available methods are:Constant value
Previous value
Next value
Nearest value
Linear interpolation
Spline interpolation
Shape-preserving cubic interpolation
Modified Akima cubic interpolation
Moving mean
Moving median
K nearest neighbors
To fill missing data, the app also supports the Signal Processing Toolbox™ function
fillgaps, which uses an autoregressive model.Denoise — To perform signal denoising, the app uses the
wdenoise(Wavelet Toolbox) function with these parameters:Wavelet family
Denoising method
Thresholding rule
For an example, see Denoise Noisy Doppler Signal. You must have a Wavelet Toolbox™ license to denoise signals in the app.
Detrend — To perform detrending, the app uses the MATLAB function
detrend. You can remove these trends from signals:Constant trends
Linear trends
Piecewise linear trends. To remove a piecewise linear trend, specify the breakpoints as a comma-separated list.
Smooth — To perform smoothing, the app uses the MATLAB function
smoothdata. The available smoothing methods are:Moving mean
Moving median
Gaussian
Linear regression
Quadratic regression
Robust linear regression
Robust quadratic regression
Savitzky-Golay filtering
Resample Signals or Estimate Envelopes
To resample or compute the envelope of one or more selected signals, expand the Functions gallery and select an option from the Convert list.
Envelope — To estimate envelopes, the app uses the Signal Processing Toolbox function
envelope. You can compute the upper envelope or the lower envelope of each signal. The available envelope estimation algorithms are:Hilbert— The app computes the signal envelope as the magnitude of the analytic signal found using the discrete Fourier transform as implemented inhilbert.FIR— The app computes the signal envelope by filtering the signal with a Hilbert FIR filter of adjustable size and using the result as the imaginary part of the analytic signal.RMS— The app computes the signal envelope by connecting RMS values computed using a moving window of adjustable length.Peak— The app computes the signal envelope by using spline interpolation over local maxima separated by an adjustable number of samples.
Note
Envelope computation does not support complex-valued signals.
Resample — To perform resampling, the app uses the Signal Processing Toolbox function
resample. The available options are:When your signal is nonuniformly sampled, you can use the app to interpolate it onto a uniform grid. You can specify the interpolation method and the sample rate at which you want the signal to be sampled. The following interpolation methods are available:
Linear interpolation
Shape-preserving piecewise cubic interpolation
Cubic spline interpolation using not-a-knot end conditions
For more information, see the
interp1reference page.When your signal is uniformly sampled, you can use the app to change its sample rate. You can specify either the desired sample rate or the factor by which you want to upsample or downsample the signal. In this case, the interpolation panel in the Resample tab is disabled because the interpolation operation does not make sense with uniformly sampled signals.
Note
The resampling operation requires time information. If you try to resample a signal in samples, the app issues a warning.
Custom Functions
To add a custom preprocessing function, expand the Functions gallery and select Add Custom Function. The app prompts you to enter the function name and a brief description:
If you have already written a preprocessing function, and the function is in the current folder or in the MATLAB path, the app incorporates it to the gallery. You can use tab completion to search for the function name.
If you have not written the function yet, the app opens a blank template in the Editor.
Custom preprocessing functions have mandatory and optional arguments:
The first input argument,
x, is the input signal. This argument must be a vector and is treated as a single channel.The second input argument,
tIn, is a vector of time values. The vector must have the same length as the signal. If the input signal has no time information, the function reads this argument as an empty array.Use
vararginto specify additional input arguments. If you do not have additional input arguments, you can omitvarargin. Enter the additional arguments as an ordered comma-separated list in the Function Parameters panel.The first output argument,
y, is the preprocessed signal.The second output argument,
tOut, is a vector of output time values. If the input signal has no time information,tOutis returned as an empty array.If an input argument is finite, the output argument must be finite. If an input argument is nonfinite, the output argument can be either finite or nonfinite.
To implement your algorithm, you can use any MATLAB or Signal Processing Toolbox function.
For more details, see Declip Saturated Signals Using Your Own Function.
Example: This function removes the DC value of a signal by subtracting its mean.
function [y,tOut] = removeDC(x,tIn)
% Remove the DC value of a signal by subtracting its mean
   y = x - mean(x);
   tOut = tIn;
end
Example: This function changes the starting time of a signal to a specified value.
function [y,tOut] = timealign(x,tIn,startTime)
% Change the starting time of a signal
   y = x;
   t = tIn;
   if ~isempty(t)
       t = t - t(1) + startTime;
   end
   tOut = t;
end
At any time, you can edit functions, edit their descriptions, or remove them using the Manage Custom Functions option in the gallery.
Note
Custom preprocessing functions must not change the complexity of the input signal.
Preprocessing Actions
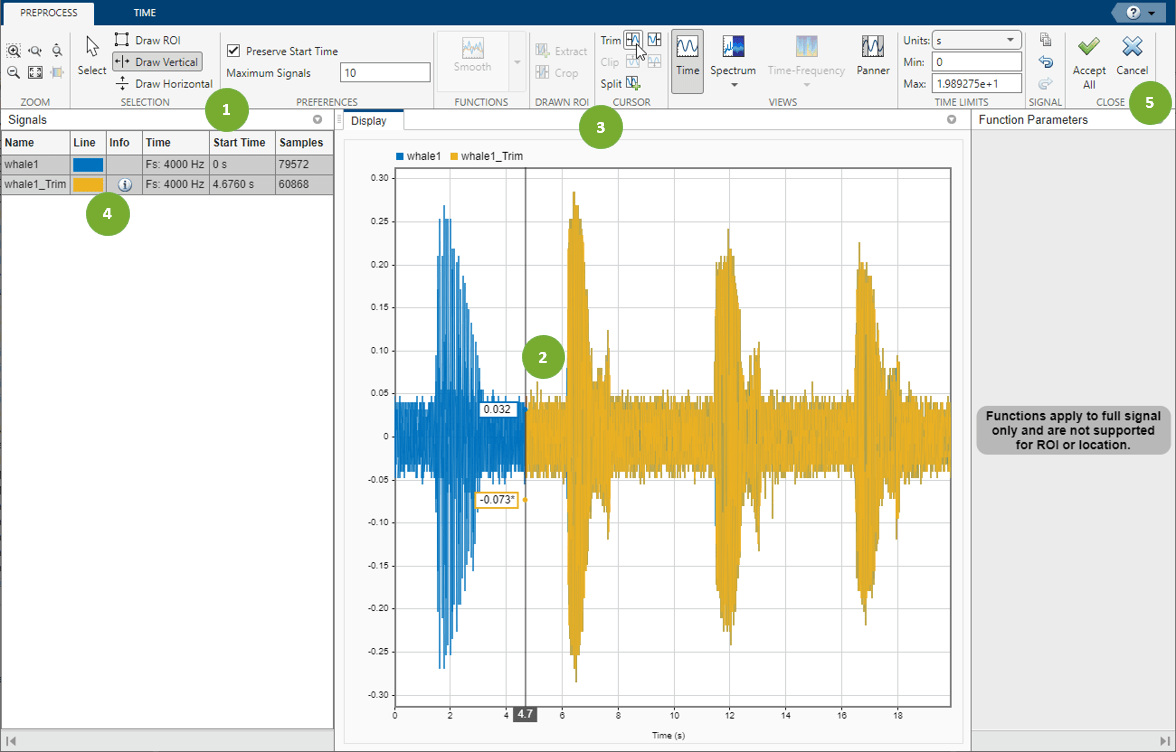
To apply a preprocessing action to one or more selected signals:
In the Selection section of the toolstrip, select to draw a region of interest (ROI) or a vertical or horizontal cursor.
Draw the ROI or cursor limits on the plot. You can also specify the limits manually.
Select a preprocessing action from the toolstrip. Options include Extract and Crop for a drawn ROI, Trim and Split for a drawn vertical cursor, and Clip for a drawn horizontal cursor.
In the Info column, click the icon to view the preprocessing history.
Click Accept All to save the preprocessing results, or click Cancel to discard the changes.
Tip
If a signal has time information, you can check the Preserve Start Time box. This option sets the start time of the modified signal to the position of the cursor when you perform the preprocessing action.
For a drawn an ROI, you can:
Extract — Create a new signal using the content inside the ROI limits.
Crop — Keep data inside the ROI limits. The crop action follows these rules:
If the cursors are on sample points, then the cropped signal contains those samples.
If the cursors are in between sample points, then the cropped signal starts from the next sample point after the left cursor and ends at the sample point before the right cursor.
For a drawn vertical cursor, you can:
Trim — Delete data from the start of the signal to the vertical cursor, or from the vertical cursor to the end of the signal. The trim action follows these rules:
If the cursor is on a sample point, then the trimmed signal contains this sample.
If the cursor is in between two sample points, then the trimmed signal starts from the sample point after the cursor for a left trim action or ends at the sample point before the cursor for a right trim action.
Split — Separate data into two signals at the vertical cursor location. The split action follows these rules:
If the signal is in samples, both split signals start from 0.
If the signal has time information and you check the Preserve Start Time box, the second split signal starts from the next time point after the cursor and the first split signal starts from the start time of the original signal. If time is not preserved, then both split signals start from 0.
If the cursor is in between two sample points, both split signals contain the two samples around the cursor. If the cursor is on a sample point, then that sample point is the last sample of the first split signal and the second split signal starts from the next sample point after the cursor.
For a drawn horizontal cursor, you can:
Clip — Delete data above or below the horizontal cursor threshold.
Previous Step
Next Step
See Also
Apps
Functions
bandpass|bandstop|detrend|envelope|highpass|lowpass|resample|smoothdata|wdenoise(Wavelet Toolbox)