聚类分析和建立分类模型检测
无监督学习方法,用于查找数据中的自然分组、模式和异常
聚类分析,也称为分割分析或分类分析,可将样本数据分成一个个组(即簇)。同一簇中的对象是相似的,不同簇中的对象则明显不同。Statistics and Machine Learning Toolbox™ 提供了几种聚类方法和相似性测度(也称为距离测度)来创建簇。此外,簇计算可以按照不同的计算标准确定数据的最佳簇数。聚类可视化选项包括树状图和轮廓图。
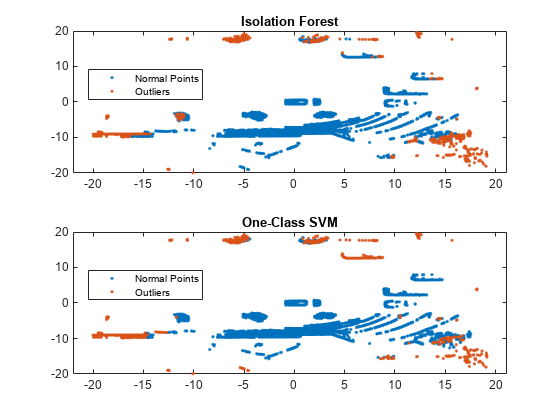
异常检测是机器学习的一个分支,用于识别偏离样本数据中预期模式或分布的观测值。Statistics and Machine Learning Toolbox 提供几种离群值和新奇值检测方法(请参阅Unsupervised Anomaly Detection),以及用于检测流数据中离群值的其他方法(请参阅Incremental Anomaly Detection Overview)。
聚类分析基础知识
类别
- 层次聚类
生成一系列嵌套的簇
- k 均值聚类和 k 中心点聚类
通过最小化均值距离或中心点距离进行聚类并计算马氏距离
- 基于密度的含噪数据空间聚类
通过使用 DBSCAN 算法来计算簇和离群值
- 谱聚类
使用基于图的算法计算簇
- 高斯混合模型
使用期望最大化算法,基于高斯混合模型进行聚类
- 最近邻
使用穷举搜索或 Kd 树搜索查找最近邻
- 隐马尔可夫模型
用于生成数据的马尔可夫模型
- 异常检测
检测离群值和新奇值
- 簇的可视化和计算
绘制数据簇并计算最佳簇数
- Python 模型协同执行
在 Simulink 中加载和协同执行用于预测的 Python 机器学习模型


