主要内容

ShiftedWeibullDistribution

R2026b

Shifted Weibull probability distribution object

Since R2026b

    Description

    A ShiftedWeibullDistribution object consists of parameters, a model description, and sample data for a shifted Weibull probability distribution.

    The shifted Weibull distribution generalizes the Weibull distribution by adding a location parameter θ. When θ = 0, the shifted Weibull distribution reduces to the two-parameter Weibull distribution. The Weibull distribution is used in reliability and lifetime modeling, and to model the breaking strength of materials.

    The shifted Weibull distribution uses the following parameters.

    ParameterDescriptionSupport
    AScale parameterA>0
    BShape parameterB>0
    thetaLocation (threshold) parameter<θ<

    Creation

    There are several ways to create a ShiftedWeibullDistribution probability distribution object:

    • Create a distribution with specified parameter values using makedist.

    • Fit a distribution to data using fitdist.

    • Interactively fit a distribution to data using the Distribution Fitter app.

    Properties

    expand all

    Distribution Parameters

    Scale parameter for the shifted Weibull distribution, specified as a positive scalar value.

    Data Types: single | double

    Shape parameter for the shifted Weibull distribution, specified as a positive scalar value.

    Data Types: single | double

    Location (threshold) parameter for the shifted Weibull distribution, specified as a numeric scalar value.

    Data Types: single | double

    Distribution Characteristics

    This property is read-only.

    Logical flag for a truncated distribution, represented as 0 or 1. If IsTruncated is 0, the distribution is not truncated. If IsTruncated is 1, the distribution is truncated.

    Data Types: logical

    This property is read-only.

    Number of parameters for the probability distribution, represented as a positive integer value.

    Data Types: double

    This property is read-only.

    Covariance matrix of the parameter estimates, represented as a p-by-p matrix, where p is the number of parameters in the distribution. The (i,j) element is the covariance between the estimates of the ith parameter and the jth parameter. The (i,i) element is the estimated variance of the ith parameter. If parameter i is fixed, and not estimated by fitting the distribution to data, then the (i,i) elements of the covariance matrix are 0.

    Data Types: double

    This property is read-only.

    Logical flag for fixed parameters, represented as an array of logical values. If the value is 0, the corresponding parameter in the ParameterNames array is not fixed. If the value is 1, the corresponding parameter in the ParameterNames array is fixed.

    Data Types: logical

    This property is read-only.

    Distribution parameter values, represented as a vector of scalar values.

    Data Types: single | double

    This property is read-only.

    Truncation interval for the probability distribution, represented as a vector of numeric scalars containing the lower and upper truncation boundaries.

    Data Types: single | double

    Other Object Properties

    This property is read-only.

    Probability distribution name, represented as a character vector.

    Data Types: char

    This property is read-only.

    Data used for distribution fitting, represented as a structure containing the following:

    • data – Data vector used for distribution fitting

    • cens – Censoring vector (empty if none)

    • freq – Frequency vector (empty if none)

    Data Types: struct

    This property is read-only.

    Distribution parameter descriptions, represented as a cell array of character vectors. Each cell contains a short description of one distribution parameter.

    Data Types: cell

    This property is read-only.

    Distribution parameter names, represented as a cell array of character vectors.

    Data Types: cell

    Object Functions

    cdfCumulative distribution function
    icdfInverse cumulative distribution function
    iqrInterquartile range of probability distribution
    meanMean of probability distribution
    medianMedian of probability distribution
    negloglikNegative loglikelihood of probability distribution
    paramciConfidence intervals for probability distribution parameters
    pdfProbability density function
    plotPlot probability distribution object
    proflikProfile likelihood function for probability distribution
    randomRandom numbers
    stdStandard deviation of probability distribution
    truncateTruncate probability distribution object
    varVariance of probability distribution

    Examples

    collapse all

    Create a shifted Weibull distribution object using the default parameter values.

    pd = makedist("ShiftedWeibull")
    pd = 
      ShiftedWeibullDistribution
    
      Shifted (3-parameter) Weibull distribution
            A = 1
            B = 1
        theta = 0


    By default, the threshold parameter theta is 0, making the distribution equivalent to the two-parameter Weibull distribution.

    Create a shifted Weibull distribution object using a scale parameter value of 2, shape parameter value of 5, and location (threshold) parameter value of 1.

    pd = makedist("ShiftedWeibull",A=2,B=5,theta=1)
    pd = 
      ShiftedWeibullDistribution
    
      Shifted (3-parameter) Weibull distribution
            A = 2
            B = 5
        theta = 1


    Generate 100 random numbers from the shifted Weibull distribution.

    r = random(pd,100,1)
    r = 100×1
    
        2.4566
        2.2592
        3.3118
        2.2373
        2.7110
        3.3681
        3.1007
        2.8079
        2.0680
        2.0272
        3.2613
        1.9909
        2.0697
        2.8743
        2.4812
          ⋮


    Plot a histogram of the random numbers.

    histogram(r)
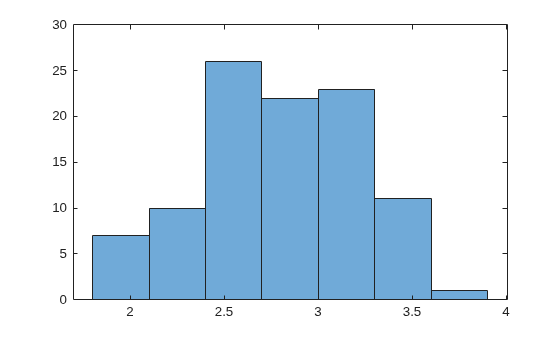
    Figure contains an axes object. The axes object contains an object of type histogram.

    Version History

    Introduced in R2026b