VariabilityChart Properties
R2026bVariabilityChart properties control the appearance and behavior
of a VariabilityChart object. By changing property values, you can modify
certain aspects of the object. Use dot notation to query and set properties.
v = variabilitychart({["A" "A" "B" "B"], [1 2 1 2]}, randi(100,1,4));
f = v.FactorNames;
v.Color = [0 0.5 0.5];
Data Display
Labels
Chart title, specified as a character vector, cell array of character vectors, string array, or categorical array. To create a multiline title, specify a cell array of character vectors, a string array, or a categorical array. Each element in the array corresponds to a line of text.
By default, VariabilityChart objects support a subset of TeX markup
for the text you specify. Use TeX markup to add superscripts and subscripts, modify the
font type and color, and include special characters in the text. If you want a TeX
markup character in regular text, such as an underscore (_), then insert a backslash (\)
before the character you want to include. The backslash is the TeX escape character. For
more information, see the Interpreter property of the text
object.
Alternatively, use the title function to add a title to the
chart.
Example: Title="Chart Title"
Data Types: char | string | cell | categorical
Chart subtitle, specified as a character vector, cell array of character vectors, string array, or categorical array. To create a multiline subtitle, specify a cell array of character vectors, a string array, or a categorical array. Each element in the array corresponds to a line of text.
By default, VariabilityChart objects support a subset of TeX markup
for the text you specify. Use TeX markup to add superscripts and subscripts, modify the
font type and color, and include special characters in the text. If you want a TeX
markup character in regular text, such as an underscore (_), then insert a backslash (\)
before the character you want to include. The backslash is the TeX escape character. For
more information, see the Interpreter property of the text
object.
Alternatively, use the title or subtitle
functions to add a subtitle to the chart.
Example: Subtitle="Chart Subitle"
Data Types: char | string | cell | categorical
Label for the x-axis, specified as a character vector, cell array
of character vectors, string array, or categorical array. To create a multiline label,
specify a cell array of character vectors, a string array, or a categorical array. Each
element in the array corresponds to a line of text. You can also use the xlabelXLabel.
By default, VariabilityChart objects support a subset of TeX markup
for the text you specify. Use TeX markup to add superscripts and subscripts, modify the
font type and color, and include special characters in the text. If you want a TeX
markup character in regular text, such as an underscore (_), then insert a backslash (\)
before the character you want to include. The backslash is the TeX escape character. For
more information, see the Interpreter property of the text
object.
Example: XLabel="X Axis"
Data Types: char | string | cell | categorical
Label for the y-axis, specified as a character vector, cell array
of character vectors, string array, or categorical array. To create a multiline label,
specify a cell array of character vectors, a string array, or a categorical array. Each
element in the array corresponds to a line of text. You can also use the ylabelYLabel.
By default, VariabilityChart objects support a subset of TeX markup
for the text you specify. Use TeX markup to add superscripts and subscripts, modify the
font type and color, and include special characters in the text. If you want a TeX
markup character in regular text, such as an underscore (_), then insert a backslash (\)
before the character you want to include. The backslash is the TeX escape character. For
more information, see the Interpreter property of the text
object.
Example: YLabel="Y Axis"
Data Types: char | string | cell | categorical
How the YLabel
property is set, specified as one of these values:
"auto"— MATLAB sets the value ofYLabeltoYVariable."manual"— You set the value ofYLabelmanually, either by specifying the y-axis label when you create aVariabilityChartobject or by setting theYLabelproperty after creating the object.
If you change the value of YLabel manually, the software
changes the value of the YLabelMode property to
"manual".
Example: YLabelMode="manual"
Label for the target value line, specified as a string scalar or character vector.
The software displays the label to the right of the y-axis followed
by the value of TargetValue. Set TargetValueLabel to an empty string
("") to remove the label from the chart.
Example: TargetValueLabel="ProductionTarget"
Data Types: char | string
How the TargetValueLabel property is set, specified as one of these values:
"auto"— MATLAB sets the value ofTargetValueLabelto"Target value:"."manual"— You set the value ofTargetValueLabelmanually, either by specifying the target value label when you create aVariabilityChartobject or by setting theTargetValueLabelproperty after creating the object.
If you change the value of TargetValueLabel manually, the
software changes the value of the TargetValueLabelMode property to
"manual".
Example: TargetValueLabelMode="manual"
Text interpreter, specified as one of these values:
"tex"— Interpret characters using a subset of TeX markup."latex"— Interpret characters using LaTeX markup."none"— Display literal characters.
MATLAB uses the interpreter when displaying a chart title, axis labels, or any data that includes text or symbols.
TeX Markup
By default, MATLAB supports a subset of TeX markup. Use TeX markup to add superscripts and subscripts, modify the font type and color, and include special characters in the text.
Modifiers remain in effect until the end of the
text. Superscripts and subscripts are an exception because they modify only the next
character or the characters within the curly braces. When you set the interpreter to
"tex", the supported modifiers are as follows.
| Modifier | Description | Example |
|---|---|---|
^{ } | Superscript | "text^{superscript}" |
_{ } | Subscript | "text_{subscript}" |
\bf | Bold font | "\bf text" |
\it | Italic font | "\it text" |
\sl | Oblique font (usually the same as italic font) | "\sl text" |
\rm | Normal font | "\rm text" |
\fontname{ | Font name — Replace
| "\fontname{Courier} text" |
\fontsize{ | Font size —Replace
| "\fontsize{15} text" |
\color{ | Font color — Replace
red, green,
yellow, magenta,
blue, black,
white, gray,
darkGreen, orange, or
lightBlue. | "\color{magenta} text" |
\color[rgb]{specifier} | Custom font color — Replace
| "\color[rgb]{0,0.5,0.5} text" |
This table lists the supported special character
sequences for the "tex" interpreter. Some of the symbols look
slightly different than they do in MATLAB.
| Character Sequence | Symbol | Character Sequence | Symbol | Character Sequence | Symbol |
|---|---|---|---|---|---|
| α |
| υ |
| ~ |
| ∠ |
| ϕ |
| ≤ |
|
|
| χ |
| ∞ |
| β |
| ψ |
| ♣ |
| γ |
| ω |
| ♦ |
| δ |
| Γ |
| ♥ |
| ϵ |
| Δ |
| ♠ |
| ζ |
| Θ |
| ↔ |
| η |
| Λ |
| ← |
| θ |
| Ξ |
| ⇐ |
| ϑ |
| Π |
| ↑ |
| ι |
| Σ |
| → |
| κ |
| ϒ |
| ⇒ |
| λ |
| Φ |
| ↓ |
| µ |
| Ψ |
| º |
| ν |
| Ω |
| ± |
| ξ |
| ∀ |
| ≥ |
| π |
| ∃ |
| ∝ |
| ρ |
| ∍ |
| ∂ |
| σ |
| ≅ |
| • |
| ς |
| ≈ |
| ÷ |
| τ |
| ℜ |
| ≠ |
| ≡ |
| ⊕ |
| ℵ |
| ℑ |
| ∪ |
| ℘ |
| ⊗ |
| ⊆ |
| ∅ |
| ∩ |
| ∈ |
| ⊇ |
| ⊃ |
| ⌈ |
| ⊂ |
| ∫ |
| · |
| ο |
| ⌋ |
| ¬ |
| ∇ |
| ⌊ |
| x |
| ... |
| ⊥ |
| √ |
| ´ |
| ∧ |
| ϖ |
| ∅ |
| ⌉ |
| 〉 |
| | |
| ∨ |
| 〈 |
| © |
LaTeX Markup
To use LaTeX markup, set the interpreter to "latex". For inline
mode, surround the markup with single dollar signs ($). For display
mode, surround the markup with double dollar signs
($$).
| LaTeX Mode | Example | Result |
|---|---|---|
| Inline |
"$\int_1^{20} x^2 dx$" |
|
| Display |
"$$\int_1^{20} x^2 dx$$" |
|
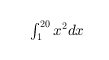
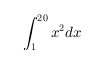
The displayed text uses the default LaTeX font style. To change the font style, use LaTeX markup.
The maximum size of the text that you can use with the LaTeX interpreter is 1200 characters. For multiline text, this reduces by about 10 characters per line.
MATLAB supports most standard LaTeX math mode commands. For more information, see Supported LaTeX Commands. For examples that use TeX and LaTeX, see Greek Letters and Special Characters in Chart Text.
Color and Styling
Marker color, specified as a value from this table
FaceColor Value | Description |
|---|---|
"flat" | Let MATLAB assign marker colors. The colors are defined in the
|
| RGB triplet or hexadecimal color code | Assign a custom color to all the markers:
The two tables below provide the RGB triplets and hexadecimal color codes for some common colors. |
| Color name or short name | Assign one predefined color to all the markers using a color name
such as The table below lists the available color names and short names. |
"none" | Display all markers without any color. |
| Color Name | Short Name | RGB Triplet | Hexadecimal Color Code | Appearance |
|---|---|---|---|---|
"red" | "r" | [1 0 0] | "#FF0000" |
|
"green" | "g" | [0 1 0] | "#00FF00" |
|
"blue" | "b" | [0 0 1] | "#0000FF" |
|
"cyan"
| "c" | [0 1 1] | "#00FFFF" |
|
"magenta" | "m" | [1 0 1] | "#FF00FF" |
|
"yellow" | "y" | [1 1 0] | "#FFFF00" |
|
"black" | "k" | [0 0 0] | "#000000" |
|
"white" | "w" | [1 1 1] | "#FFFFFF" |
|
"none" | Not applicable | Not applicable | Not applicable | No color |








This table lists the default color palettes for plots in the light and dark themes.
| Palette | Palette Colors |
|---|---|
Before R2025a: Most plots use these colors by default. |
|
|
|


You can get the RGB triplets and hexadecimal color codes for these palettes using the orderedcolors and rgb2hex functions. For example, get the RGB triplets for the "gem" palette and convert them to hexadecimal color codes.
RGB = orderedcolors("gem");
H = rgb2hex(RGB);
Before R2024a: Get the hexadecimal color codes using
H = compose("#%02X%02X%02X",round(RGB*255)).
Before R2023b: Get the RGB triplets using RGB =
get(groot,"FactoryAxesColorOrder").
Example: Color="#f00355"
Data Types: char | string | double
Color order, specified as a three-column matrix of RGB triplets. This property
defines the palette of colors MATLAB uses to color the data points by the factor
specified by FactorWithColors. Each row of the array is an RGB triplet. An RGB triplet
is a three-element vector whose elements specify the intensities of the red, green, and
blue components of a color. The intensities must be in the range [0, 1]. This table
lists the default colors.
| Colors | ColorOrder Matrix |
|---|---|
|
    [    0    0.4470    0.7410
    0.8500    0.3250    0.0980
    0.9290    0.6940    0.1250
    0.4940    0.1840    0.5560
    0.4660    0.6740    0.1880
    0.3010    0.7450    0.9330
0.6350 0.0780 0.1840] |
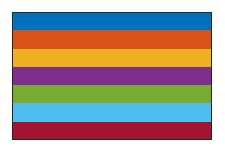
MATLAB assigns colors to each level of the factor specified by the
FactorWithColors property according to the order of the
levels.
An alternative way to set this property is to pass the
VariabilityChart object to the colororder
function.
How the ColorOrder property is set,
specified as one of these values:
"auto"— MATLAB sets the value ofColorOrderto the default color order."manual"— You set the value ofColorOrdermanually, either by specifying the color order when you create aVariabilityChartobject or by setting theColorOrderproperty after creating the object.
If you change the value of ColorOrder manually, the software
changes the value of the ColorOrderMode property to
"manual".
Example: ColorOrderMode="manual"
Font size, specified as a positive scalar. FontSize is the same
for the title, labels, factor names, and level display names. The default font size
depends on the specific operating system and locale.
As you adjust the size of plot elements, the software automatically updates the font
size. However, changing the FontSize property disables this
automatic resizing.
Example: v.FontSize = 12
How the FontSize property is set,
specified as one of these values:
"auto"— MATLAB controls the value ofFontSizeby calculating it automatically."manual"— You set the value ofFontSizemanually, either by specifying the font size when you create aVariabilityChartobject or by setting theFontSizeproperty after creating the object.
If you change the value of FontSize manually, the software
changes the value of the FontSizeMode property to
"manual".
Example: FontSizeMode="manual"
Markers
Marker symbol, specified as one of the options listed in this table:
| Marker | Description | Resulting Marker |
|---|---|---|
"o" | Circle |
|
"+" | Plus sign |
|
"*" | Asterisk |
|
"." | Point |
|
"x" | Cross |
|
"_" | Horizontal line |
|
"|" | Vertical line |
|
"square" | Square |
|
"diamond" | Diamond |
|
"^" | Upward-pointing triangle |
|
"v" | Downward-pointing triangle |
|
">" | Right-pointing triangle |
|
"<" | Left-pointing triangle |
|
"pentagram" | Pentagram |
|
"hexagram" | Hexagram |
|
"none" | No markers | Not applicable |


Example: Marker="x"
Data Types: char | string
Marker size, specified as a nonnegative scalar, with values measured in points. One point equals 1/72 inches.
Example: MarkerSize=30
Data Types: single | double |
State of marker face fill, specified as "on" or
"off", or as numeric or logical 1
(true) or 0 (false). A value
of "on" is equivalent to true, and
"off" is equivalent to false. Thus, you can use
the value of this property as a logical value. The value is stored as an on/off logical
value of type matlab.lang.OnOffSwitchState.
"on"— Fill the interior of the markers."off"— Leave the interior of the markers empty.
Example: MarkerFilled="off"
Data Types: char | string
Marker transparency, specified as a numeric scalar with values between 0 and 1. Values closer to 0 specify more transparent markers, and values closer to 1 specify more opaque markers.
Example: MarkerAlpha=0.75
Data Types: single | double |
Data
Position
Layout
Display the axes toolbar, specified as "on" or
"off", or as numeric or logical 1
(true) or 0 (false). A value
of "on" is equivalent to true, and
"off" is equivalent to false. Thus, you can use
the value of this property as a logical value. The value is stored as an on/off logical
value of type matlab.lang.OnOffSwitchState.
"on"— Display the toolbar."off"— Do not display the toolbar.
Example: ToolbarVisible="off"
Data Types: logical | char | string
State of visibility, specified as "on" or
"off", or as numeric or logical 1
(true) or 0 (false). A value
of "on" is equivalent to true, and
"off" is equivalent to false. Thus, you can use
the value of this property as a logical value. The value is stored as an on/off logical
value of type matlab.lang.OnOffSwitchState.
"on"— Display the variability chart."off"— Hide the variability chart without deleting it. You still can access the properties of an invisible object.
Example: Visible="off"
Data Types: logical | char | string
Layout options, specified as a TiledChartLayoutOptions or
GridLayoutOptions object. This property is useful when the chart
is either in a tiled chart layout or a grid layout.
To position the chart within the grid of a tiled chart layout, set the
Tile and TileSpan properties on the
TiledChartLayoutOptions object. For example, consider a 3-by-3
tiled chart layout. The layout has a grid of tiles in the center, and four tiles along
the outer edges. In practice, the grid is invisible and the outer tiles do not take up
space until you populate them with axes or charts.
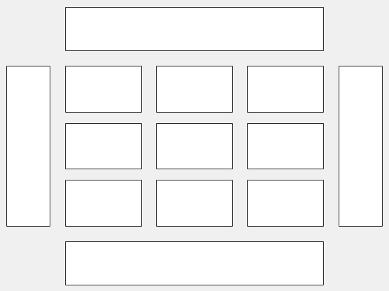
This code places the chart c in the third tile of the
grid.
c.Layout.Tile = 3;
To make the chart span multiple tiles, specify the TileSpan
property as a two-element vector. For example, this chart spans 2
rows and 3 columns of
tiles.
c.Layout.TileSpan = [2 3];
To place the chart in one of the surrounding tiles, specify the
Tile property as "north",
"south", "east", or "west".
For example, setting the value to "east" places the chart in the tile
to the right of the
grid.
c.Layout.Tile = "east";To place the chart into a layout within an app, specify this property as a
GridLayoutOptions object. For more information about working with
grid layouts in apps, see uigridlayout.
If the chart is not a child of either a tiled chart layout or a grid layout (for example, if it is a child of a figure or panel) then this property is empty and has no effect.
Parent/Child
Version History
Introduced in R2026b

