信号分析和可视化
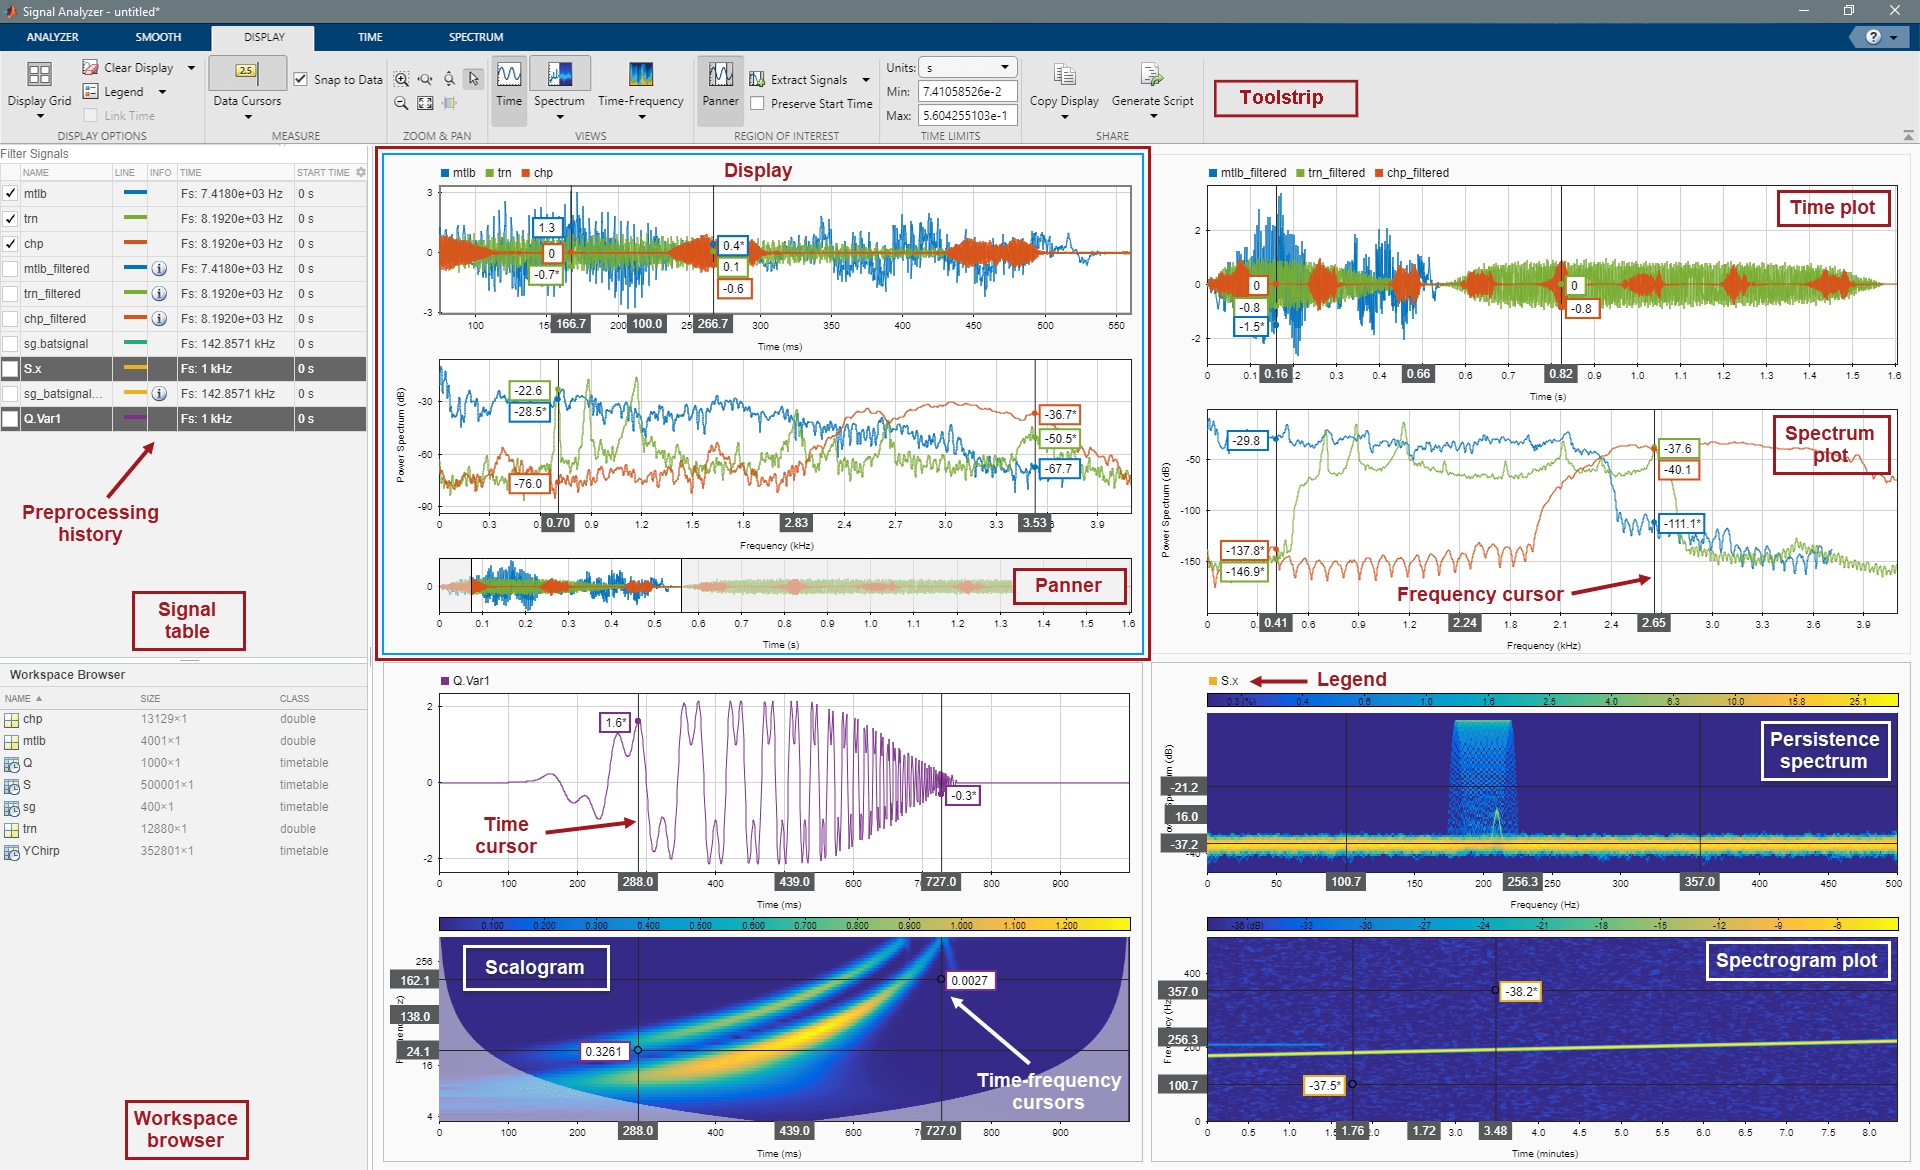
信号分析器是一款交互式工具,用于在时域、频域和时频域中可视化、测量、分析和比较信号。通过该 App 可同时和在同一视图中处理不同持续时间的许多信号。
从 MATLAB® 工具条上的 Apps 选项卡中选择该 App 将其启动。您也可以通过在 MATLAB 命令提示符下键入 signalAnalyzer 来启动该 App。
App
| 信号分析器 | 可视化和比较多个信号和频谱 |
函数
strips | 带状图 |
主题
App 工作流
- 使用信号分析器
在时域、频域和时频域中可视化、测量、分析和比较信号。
- 步骤 1: Select Signals to Analyze
- 步骤 2: Preprocess Signals
- 步骤 3: Explore Signals
- 步骤 4: Measure Signals
- 步骤 5: Share Analysis
频谱和时频分析
- Spectrum Computation in Signal Analyzer
To compute signal spectra, Signal Analyzer finds a compromise between the best theoretical spectral resolution and the best resolution allowed by performance constraints. - Persistence Spectrum in Signal Analyzer
The persistence spectrum contains time-dependent probabilities of occurrence of signals at given frequency locations and power levels. - 信号分析器中的频谱图计算
为了显示非平稳信号的时间相关频谱,信号分析器将信号分成若干重叠的凯塞窗段,并计算其短时傅里叶变换。 - Scalogram Computation in Signal Analyzer
The scalogram is useful for identifying signals with low-frequency components and for analyzing signals whose frequency content changes rapidly with time.
辅助主题
- Data Types Supported by Signal Analyzer
Signal Analyzer accepts vectors and matrices,timeseriesobjects, and MATLAB timetables. - Edit Sample Rate and Other Time Information
You can add and edit the time information in the Signal Analyzer app for any signal that is not a MATLAB timetable or atimeseriesobject. - Signal Analyzer Tips and Limitations
Prepare data to circumvent current limitations of Signal Analyzer. - Keyboard Shortcuts for Signal Analyzer
Use the keyboard to control the Signal Analyzer app. - Customize Signal Analyzer
Specify line color and style, add or remove columns in the Signal table, and modify Signal Analyzer displays.
相关信息
精选示例

通过调节窗泄漏来解析音调
在信号分析器中调节频谱泄漏以解析正弦波。

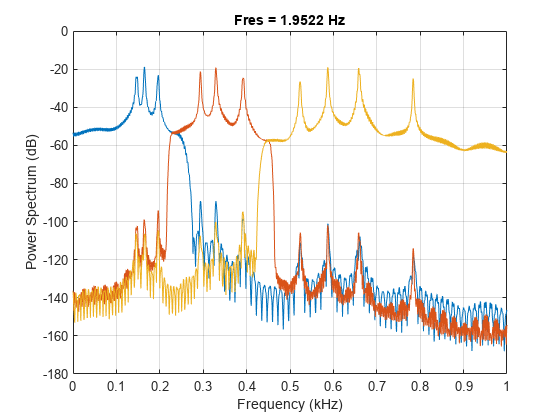
使用不同的窗计算信号频谱
计算信号的频谱,并通过修改窗形状和大小来更改其分辨率。
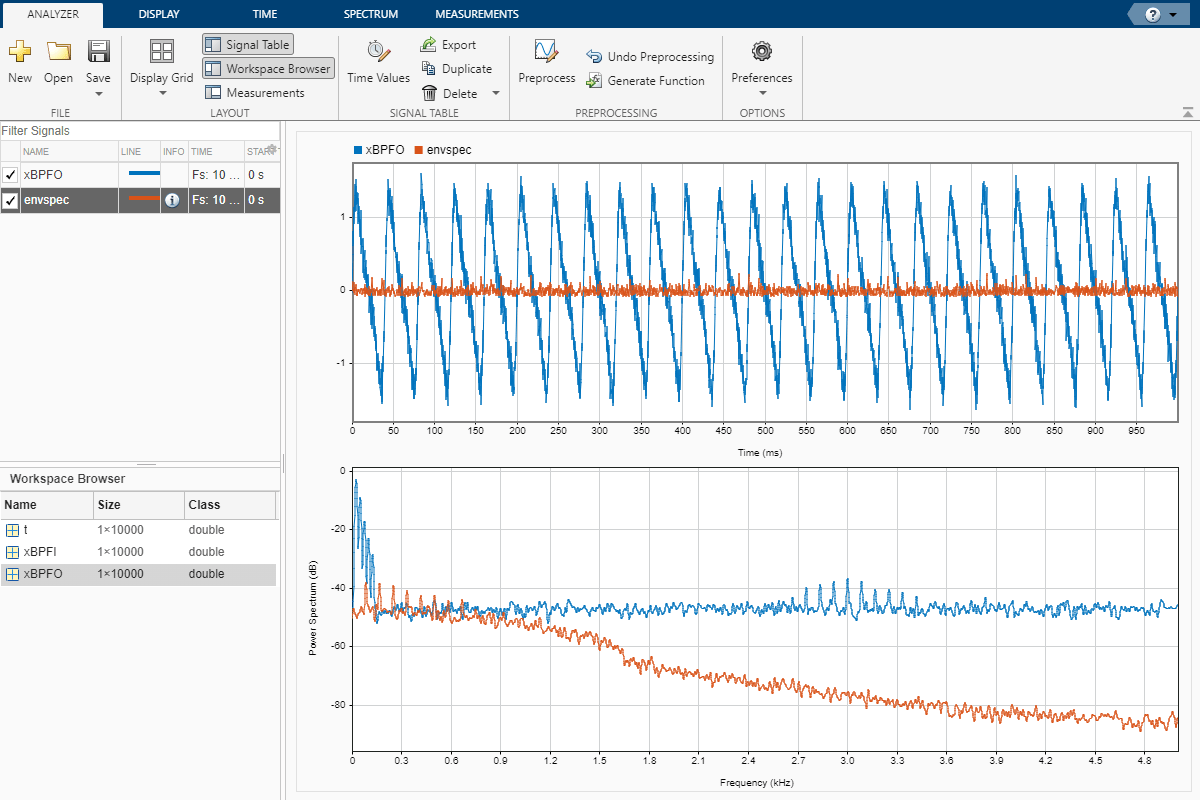
Compute Envelope Spectrum of Vibration Signal
Compute the envelope spectrum of a signal and combine app-generated scripts and functions into a single workflow.

Declip Saturated Signals Using Your Own Function
Write a function to declip saturated signals and include it in Signal Analyzer.
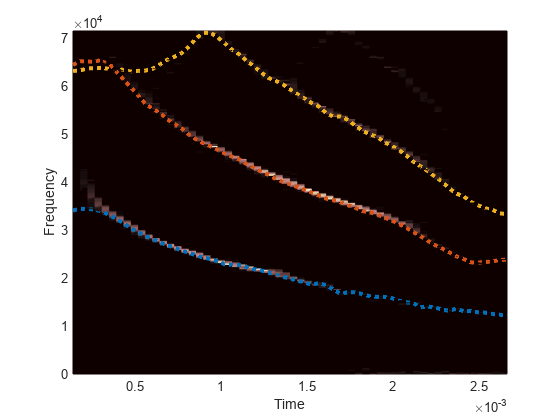
Find and Track Ridges Using Reassigned Spectrogram
Use the reassigned spectrogram in Signal Analyzer to sharpen the time and frequency localization of spectrograms.
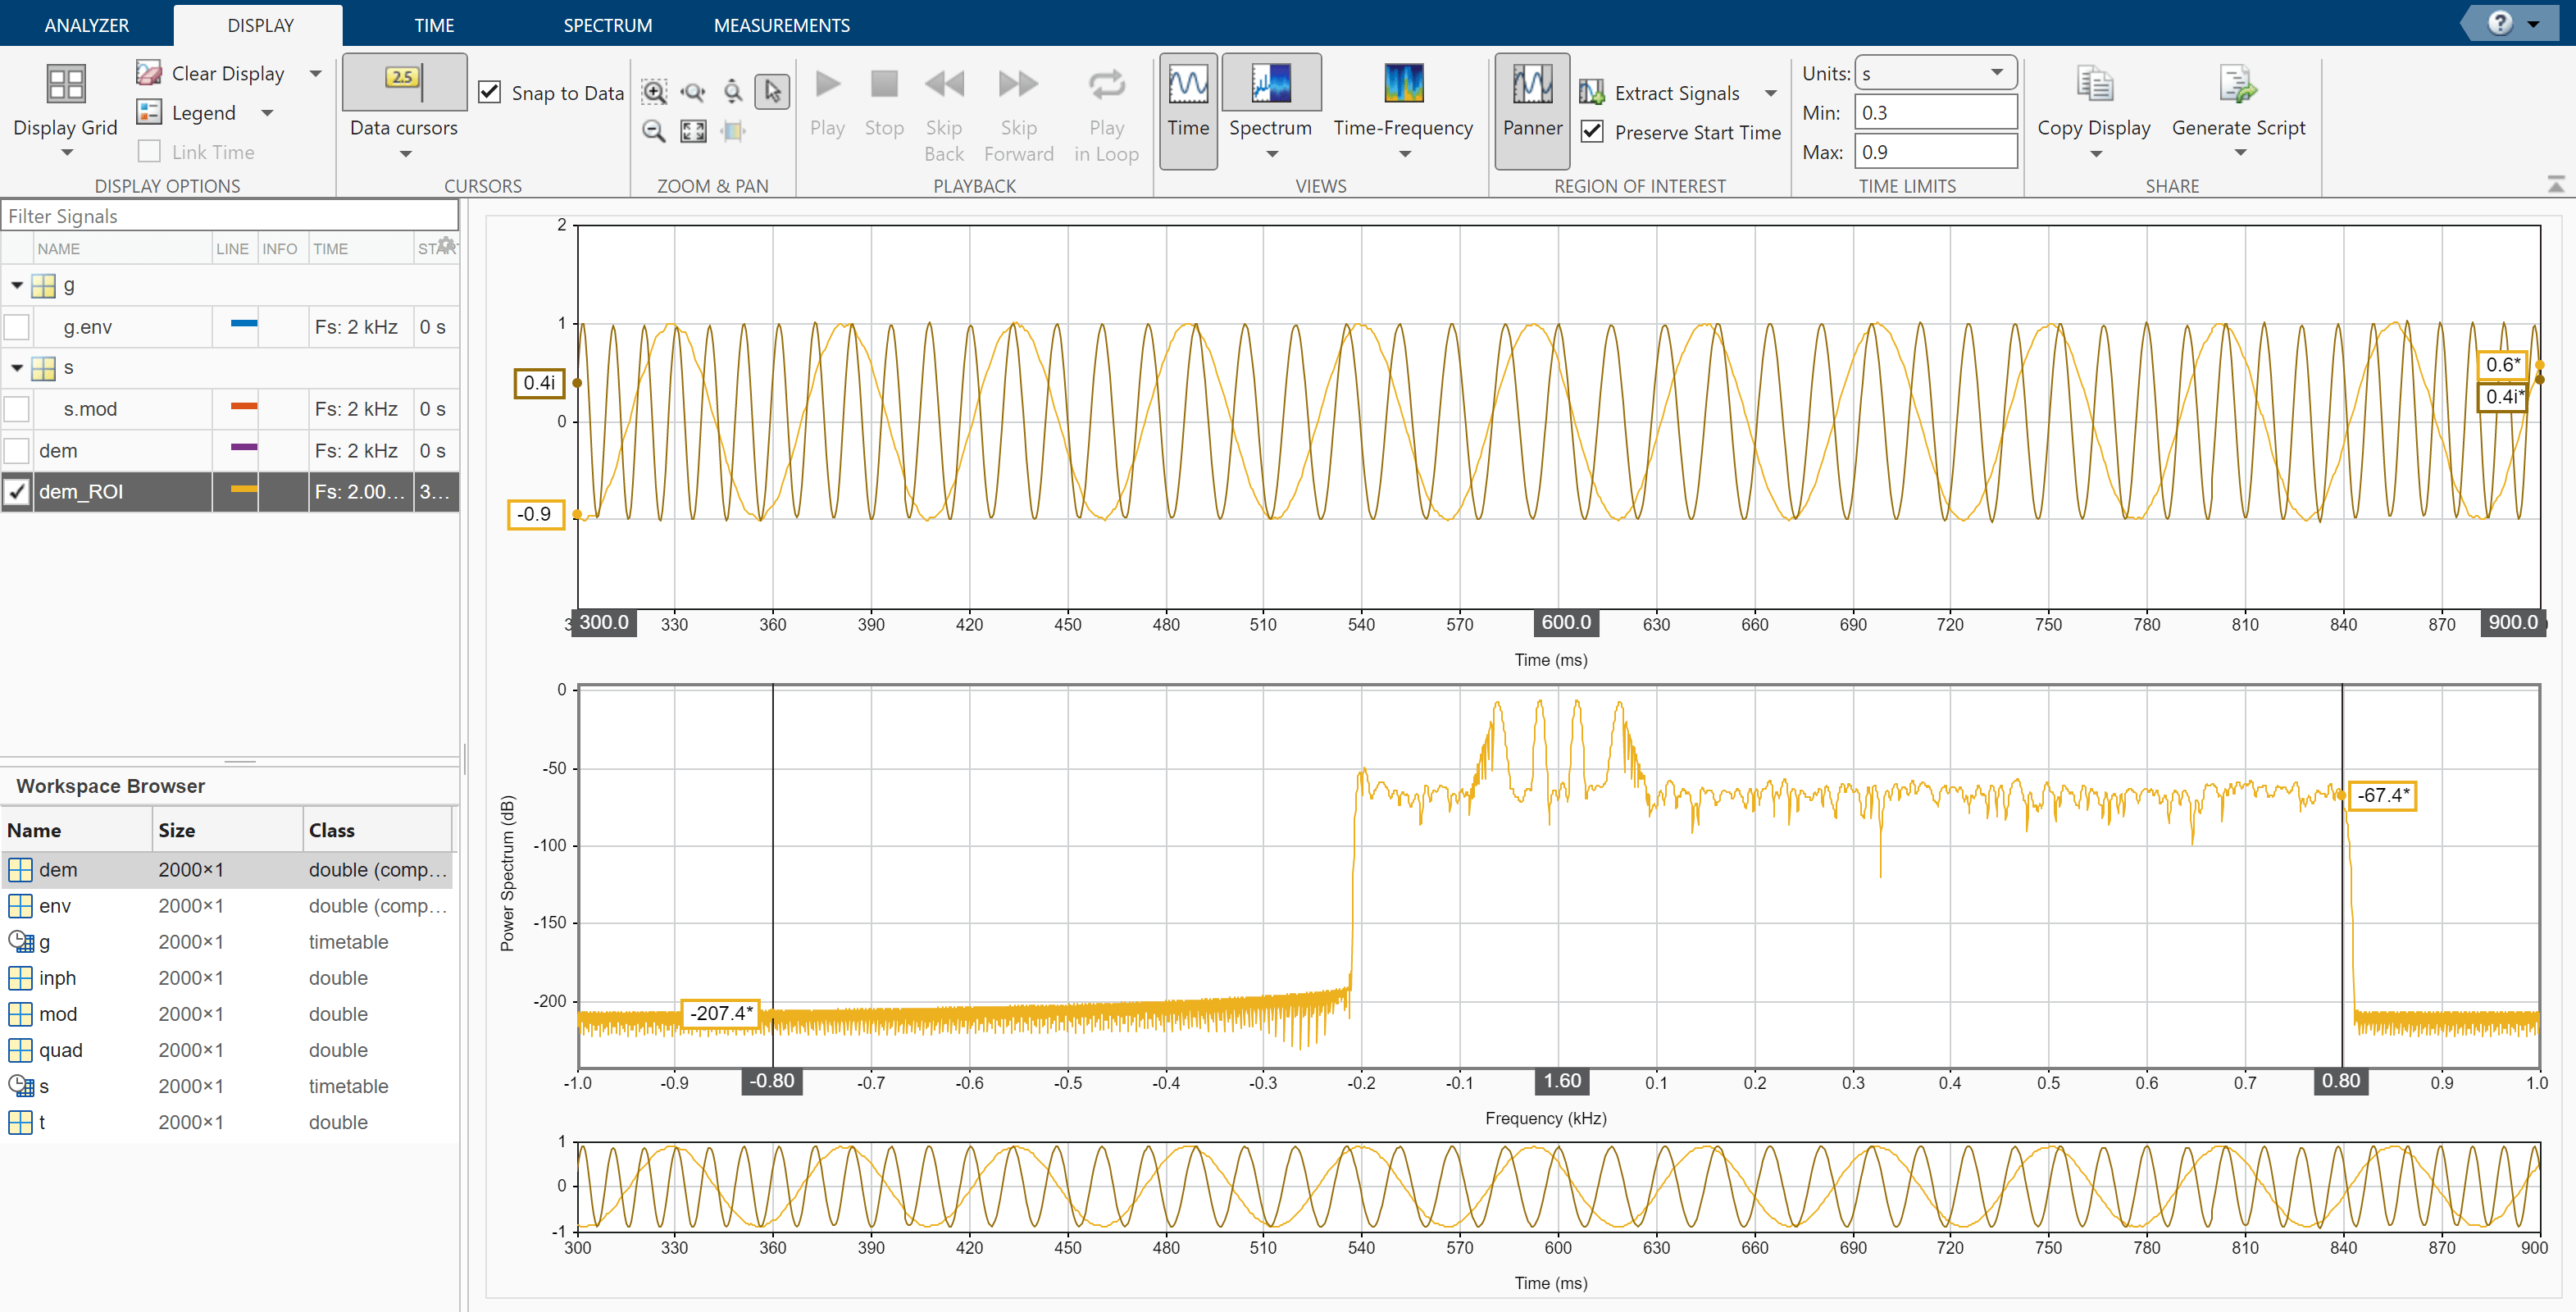
Modulation and Demodulation Using Complex Envelope
Visualize complex-valued signals in Signal Analyzer.
Extract Voices from Music Signal
Use Signal Analyzer to extract voices from a song by duplicating and filtering signals.
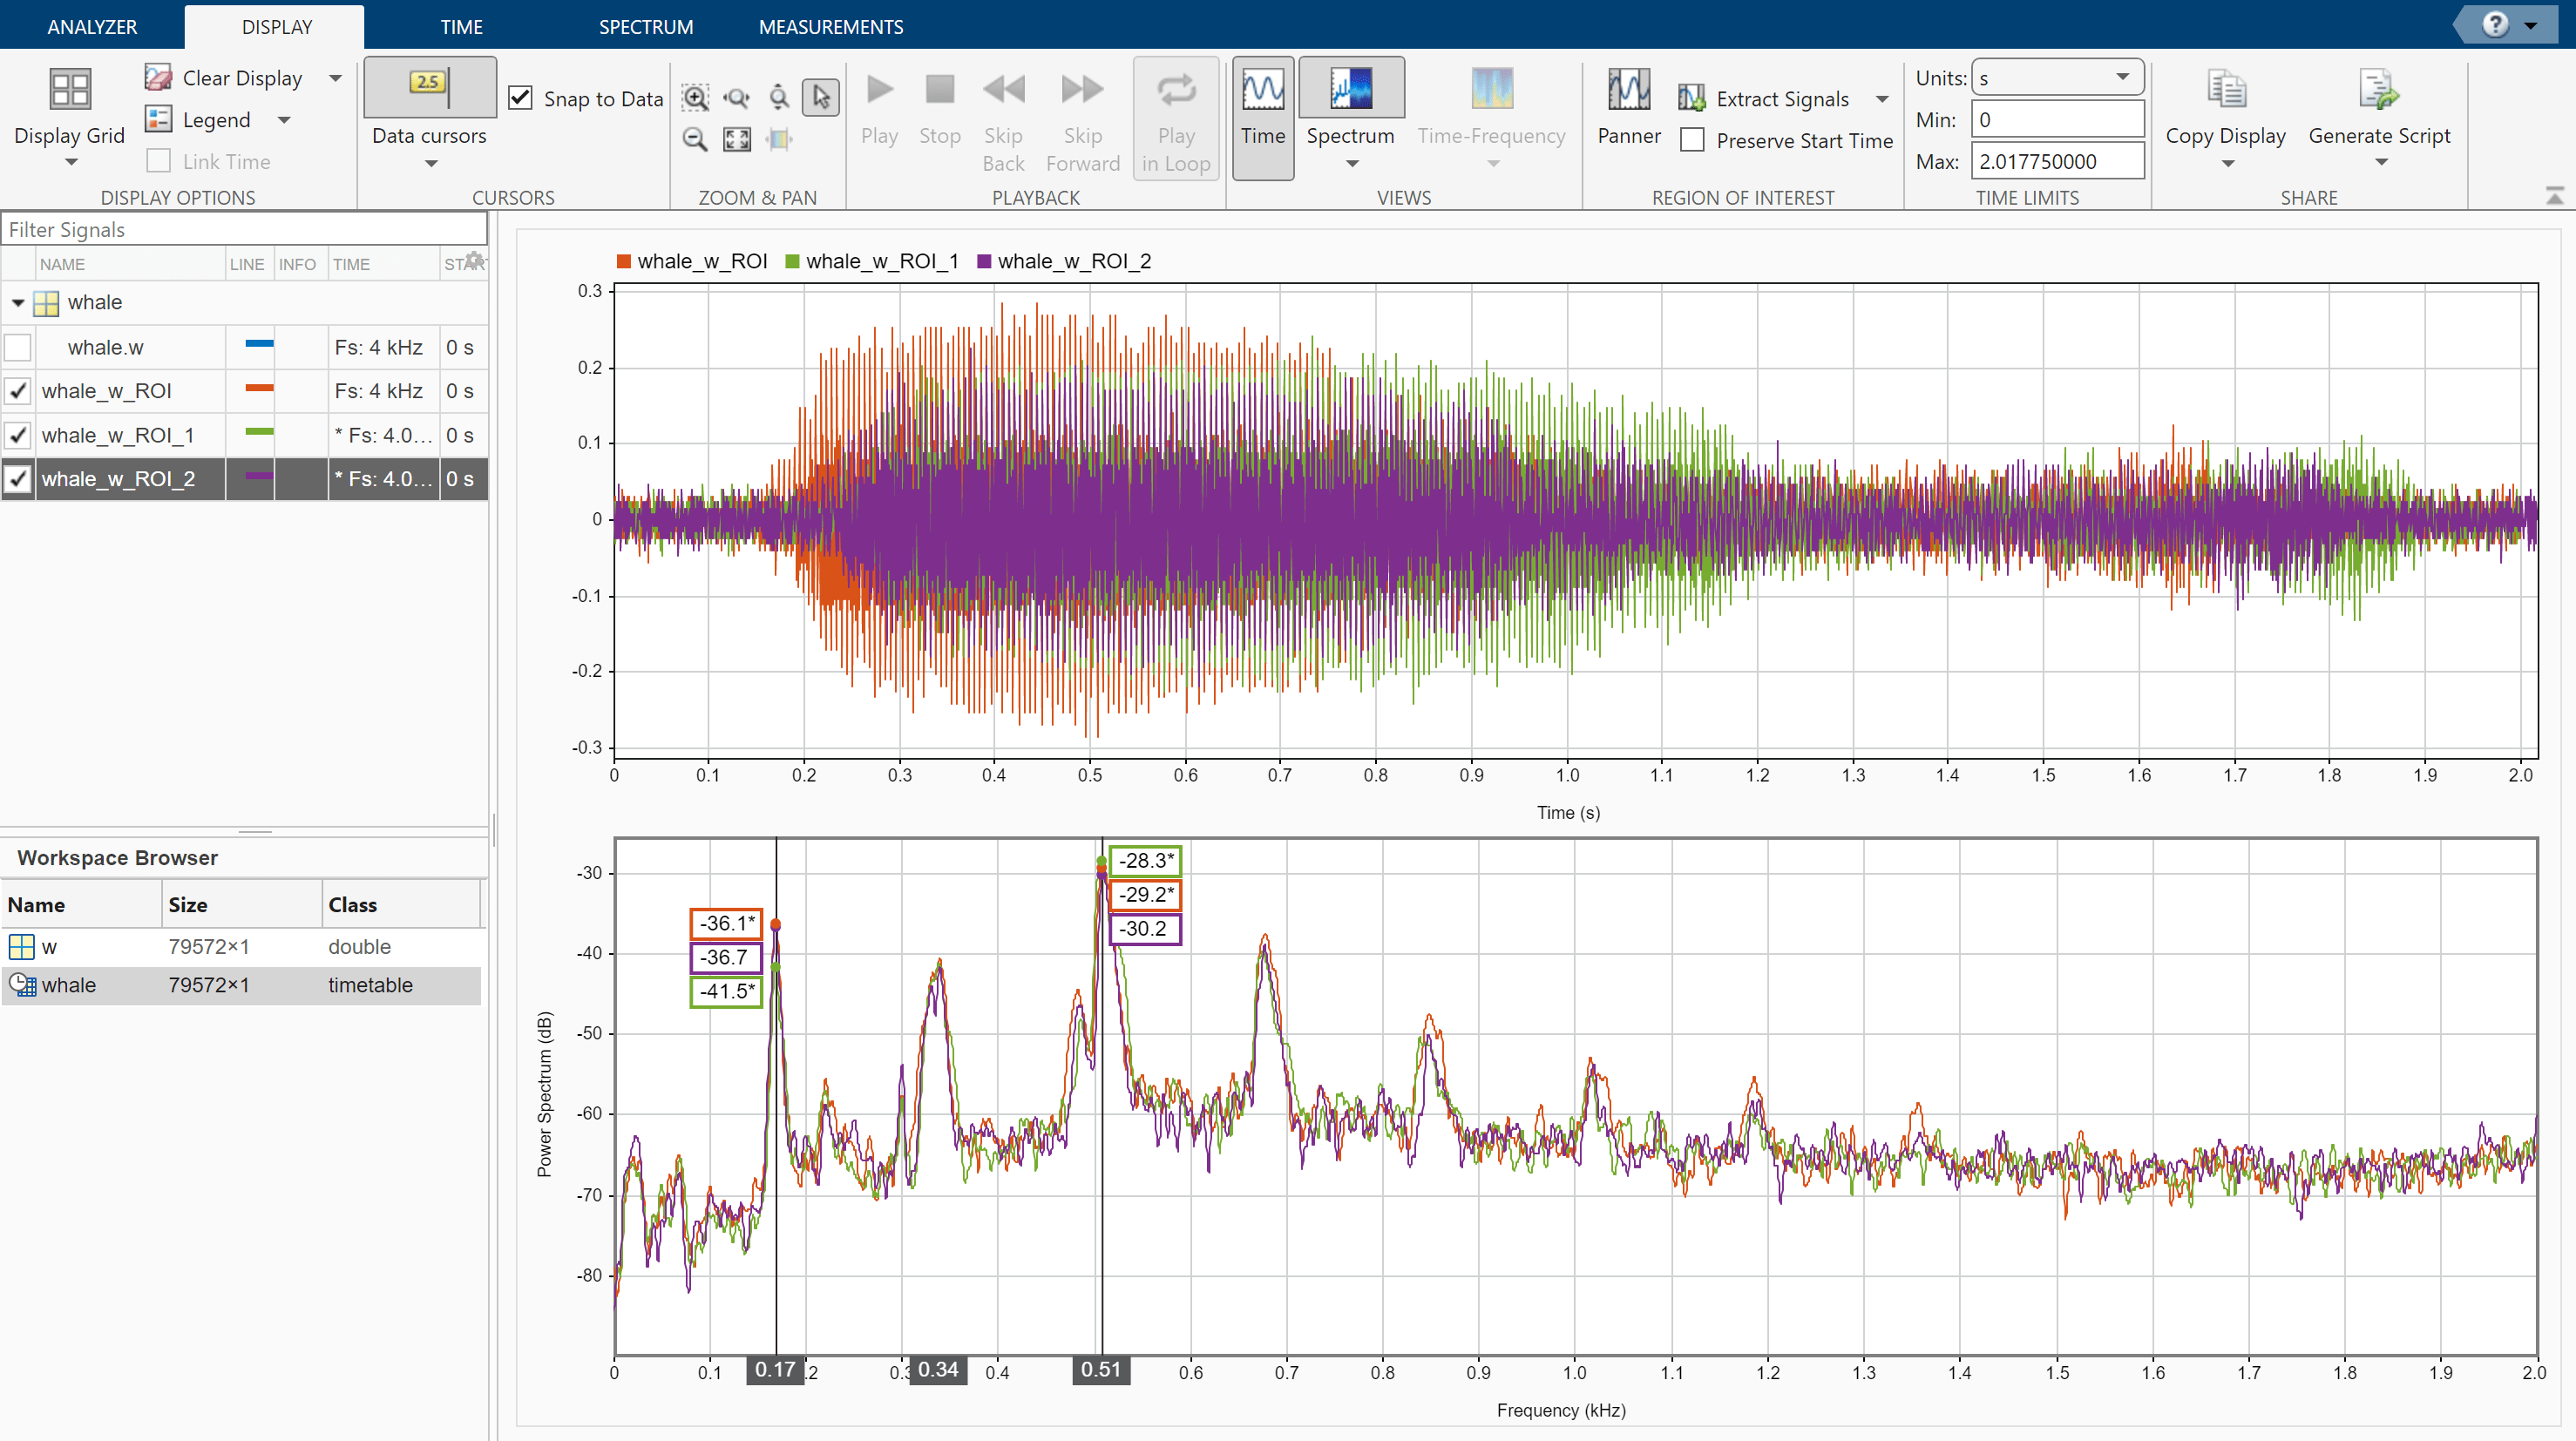
从鲸鱼音频中提取感兴趣的区域
在信号分析器中提取感兴趣的信号区域。