Extract Voices from Music Signal
Implement a basic digital music synthesizer and use it to play a traditional song in a three-voice arrangement. Specify a sample rate of 2 kHz. Save the song as a MATLAB® timetable.
fs = 2e3;
t = 0:1/fs:0.3-1/fs; fq = [-Inf -9:2]/12;
note = @(f,g) [1 1 1]*sin(2*pi*440*2.^[fq(g)-1 fq(g) fq(f)+1]'.*t);

mel = [5 3 1 3 5 5 5 0 3 3 3 0 5 8 8 0 5 3 1 3 5 5 5 5 3 3 5 3 1]+1;
acc = [5 0 8 0 5 0 5 5 3 0 3 3 5 0 8 8 5 0 8 0 5 5 5 0 3 3 5 0 1]+1;

song = [];
for kj = 1:length(mel)
    song = [song note(mel(kj),acc(kj)) zeros(1,0.01*fs)];
end
song = song'/(max(abs(song))+0.1);

tune = timetable(song,SampleRate=fs);
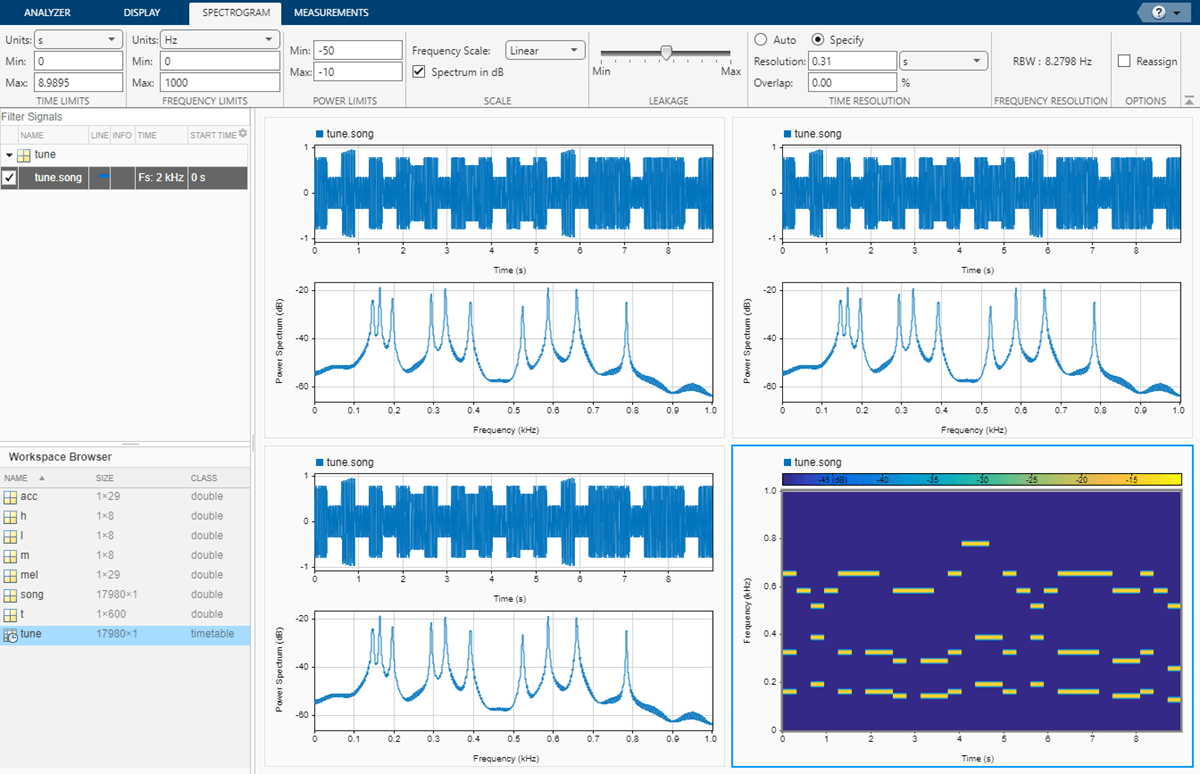
Open Signal Analyzer and drag the timetable from the Workspace Browser to the Signal table. To hear an audio signal, select it and click Play in the Playback section of the toolstrip under the Display tab to play the entire signal once. Select Play in Loop and then click Play to play the signal repeatedly. Click Display Grid to create a two-by-two grid of displays. Add a spectrum view to the top two displays and the lower left display. Select the lower right display, click Spectrogram/Time-Frequency in the Views section of the Display tab to add a spectrogram view, and click Time to remove the time view. Drag the song to all four displays. Select the lower right display, and on the Spectrogram tab, specify a time resolution of 0.31 second and 0% overlap between adjoining segments. Set the Power Limits to –50 dB and –10 dB.
On the Analyzer tab, click Duplicate three times to create three copies of the song. Rename the copies as high, medium, and low by double-clicking the Name column in the Signal table. Move the copies to the top two and lower left displays.
Select all three duplicate signals in the Signal table and click Preprocess to enter the preprocessing mode.
Select the
highsignal by clicking its name in the Signal table. Select Highpass from the Functions gallery. In the Function Parameters panel, enter a passband frequency of450Hz and increase the steepness to0.95. Click Apply.Select the
mediumsignal by clicking its name in the Signal table. Select Bandpass from the Functions gallery. In the Function Parameters panel, enter230Hz and450Hz as the lower and upper passband frequencies, respectively. Increase the steepness to0.95. Click Apply.Select the
lowsignal by clicking its name in the Signal table. Select Lowpass from the Functions gallery. In the Function Parameters panel, enter a passband frequency of230Hz and increase the steepness to0.95. Click Apply.
Click Accept All to save the preprocessing results and exit the mode.
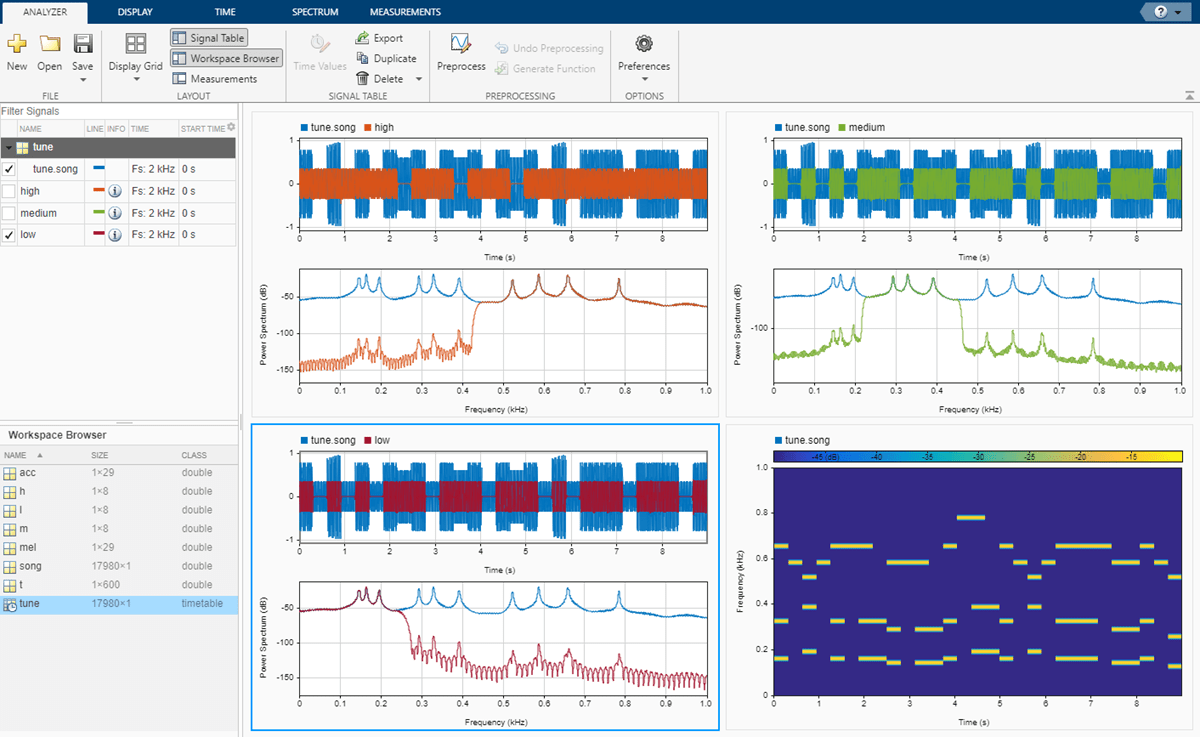
View a spectrogram on each of the three displays containing filtered signals.
Remove the original signal by clearing the check box next to its name.
On the Views section of the Display tab, click Spectrogram/Time-Frequency to add a spectrogram view and click Time to remove the time view.
On the Spectrogram tab, specify a time resolution of
0.31second and0% overlap between adjoining segments. Set the Power Limits to–50dB and–10dB.

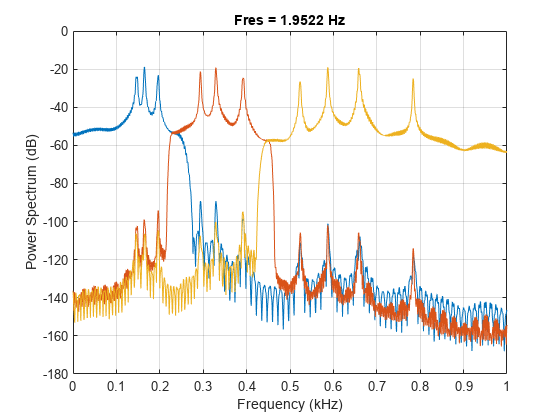
Select the three filtered signals by clicking their Name column in the Signal table. On the Analyzer tab, click Export and save the signals to a MAT file called music.mat. In MATLAB, load the file to the Workspace. Plot the spectra of the three signals.
load music

pspectrum(low)
hold on
pspectrum(medium)
pspectrum(high)
hold off
% To hear the different voices, type
% sound(low.low,fs), pause(5), sound(medium.medium,fs), pause(5), sound(high.high,fs)
See Also
Apps
Functions
Topics
- Find Delay Between Correlated Signals
- Resolve Tones by Varying Window Leakage
- Compute Signal Spectrum Using Different Windows
- Find Interference Using Persistence Spectrum
- Modulation and Demodulation Using Complex Envelope
- Find and Track Ridges Using Reassigned Spectrogram
- Resample and Filter a Nonuniformly Sampled Signal
- Declip Saturated Signals Using Your Own Function
- Compute Envelope Spectrum of Vibration Signal
- Extract Regions of Interest from Whale Song
- Use Signal Analyzer App
- Edit Sample Rate and Other Time Information
- Data Types Supported by Signal Analyzer
- Spectrum Computation in Signal Analyzer
- Persistence Spectrum in Signal Analyzer
- Spectrogram Computation in Signal Analyzer
- Scalogram Computation in Signal Analyzer
- Keyboard Shortcuts for Signal Analyzer
- Signal Analyzer Tips and Limitations