Find Interference Using Persistence Spectrum
Visualize an interference narrowband signal embedded in a broadband signal.
Generate a chirp sampled at 1 kHz for 500 seconds. The frequency of the chirp increases from 180 Hz to 220 Hz during the measurement.
fs = 1000;
t = (0:1/fs:500)';
x = chirp(t,180,t(end),220) + 0.15*randn(size(t));
The signal also contains a 210 Hz sinusoid. The sinusoid has an amplitude of 0.05 and is present only for 1/6 of the total signal duration.
idx = floor(length(x)/6);
x(1:idx) = x(1:idx) + 0.05*cos(2*pi*t(1:idx)*210);
Save the signal as a MATLAB® timetable.
S = timetable(seconds(t),x);
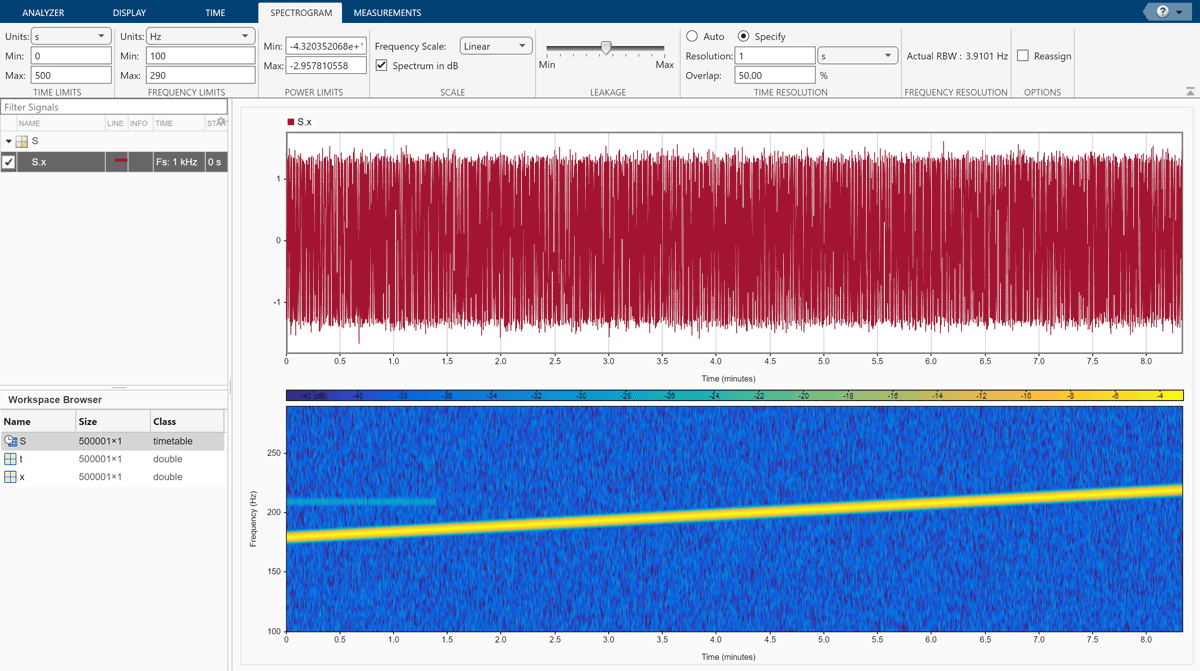
Open Signal Analyzer and drag the timetable from the Workspace Browser to a display. Click the Spectrogram/Time-Frequency button in the Views section of the Display tab to add a spectrogram view. On the Spectrogram tab, under Time Resolution, select Specify and enter a time resolution of 1 second. Set the Frequency Limits to 100 Hz and 290 Hz. Both signal components are visible.
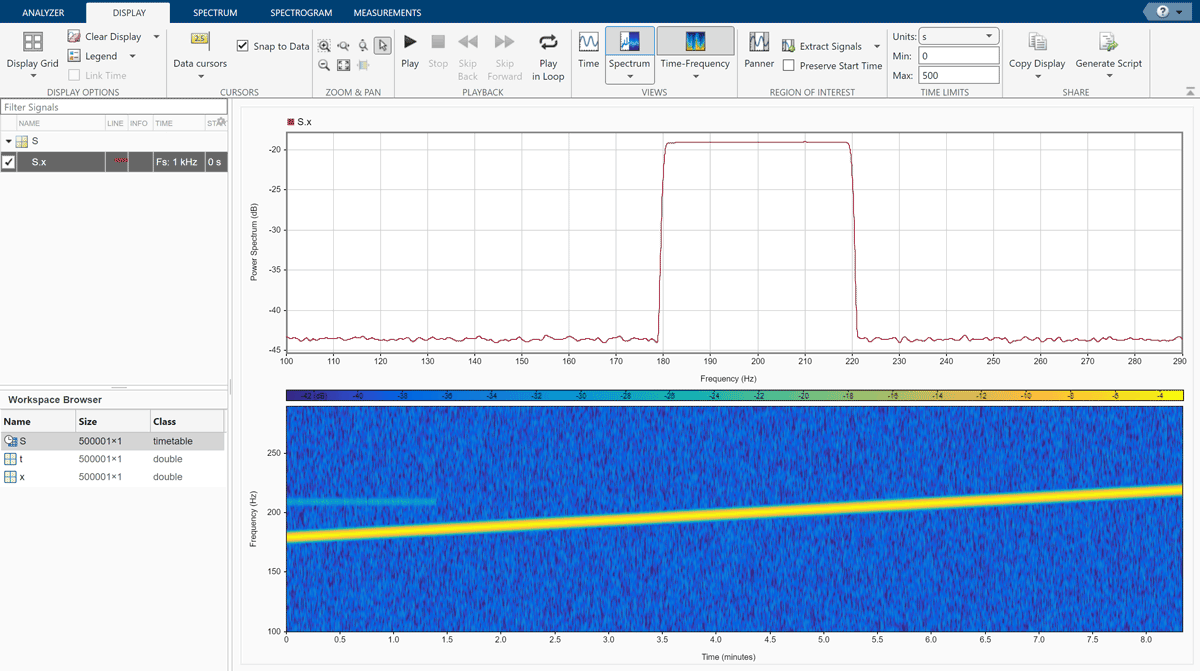
Go back to the Display tab. Click the Time button to remove the time view and click the Spectrum button to add a power spectrum view. The frequency range continues to be from 100 Hz to 290 Hz. The weak sinusoid is obscured by the chirp.
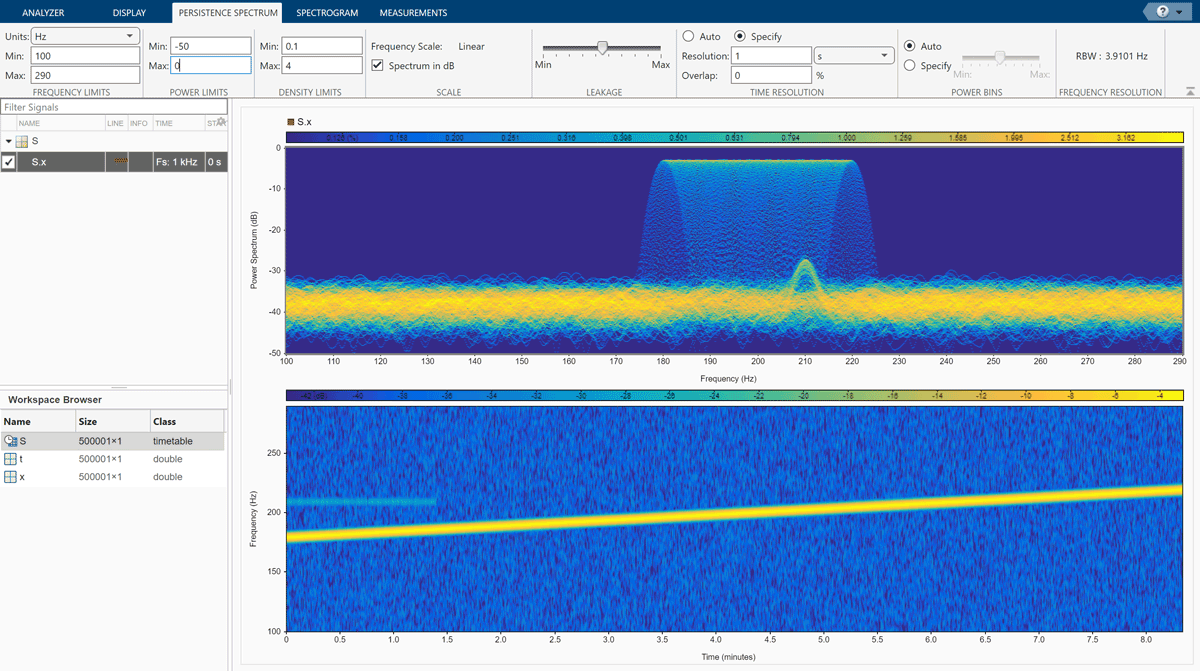
Click the arrow under the Spectrum button to change the Spectrum view to a Persistence Spectrum view. On the Persistence Spectrum tab, under Time Resolution, select Specify and enter a time resolution of 1 second. Specify zero overlap between adjoining segments. Set the Power Limits to –50 dB and 0 dB and the Density Limits to 0.1 and 4. Now both signal components are clearly visible.
On the Display tab, under Share, click Generate Script and select Persistence Spectrum Script. The script appears in the MATLAB Editor.
% Compute persistence spectrum

% Generated by MATLAB(R) 9.7 and Signal Processing Toolbox 8.2.
% Generated on: 26-Dec-2018 16:07:45

% Parameters
timeLimits = seconds([0 500]); % seconds
frequencyLimits = [100 290]; % Hz
timeResolution = 1; % seconds
overlapPercent = 0;

%%
% Index into signal time region of interest
S_x_ROI = S(:,'x');
S_x_ROI = S_x_ROI(timerange(timeLimits(1),timeLimits(2),'closed'),1);

% Compute spectral estimate
% Run the function call below without output arguments to plot the results
[P,F,PWR] = pspectrum(S_x_ROI, ...
    'persistence', ...
    'FrequencyLimits',frequencyLimits, ...
    'TimeResolution',timeResolution, ...
    'OverlapPercent',overlapPercent);
See Also
Apps
Functions
Topics
- Find Delay Between Correlated Signals
- Resolve Tones by Varying Window Leakage
- Compute Signal Spectrum Using Different Windows
- Modulation and Demodulation Using Complex Envelope
- Find and Track Ridges Using Reassigned Spectrogram
- Extract Voices from Music Signal
- Resample and Filter a Nonuniformly Sampled Signal
- Declip Saturated Signals Using Your Own Function
- Compute Envelope Spectrum of Vibration Signal
- Extract Regions of Interest from Whale Song
- Use Signal Analyzer App
- Edit Sample Rate and Other Time Information
- Data Types Supported by Signal Analyzer
- Spectrum Computation in Signal Analyzer
- Persistence Spectrum in Signal Analyzer
- Spectrogram Computation in Signal Analyzer
- Scalogram Computation in Signal Analyzer
- Keyboard Shortcuts for Signal Analyzer
- Signal Analyzer Tips and Limitations