boxLabelDatastore
Datastore for bounding box label data
Description
The boxLabelDatastore object creates a datastore for
bounding box label data. Use this object to read labeled bounding box data for object
detection.
To read bounding box label data from a boxLabelDatastore object,
use the read
function. This object function returns a cell array with either two or three columns.
You can create a datastore that combines the boxLabelDatastore object
with an ImageDatastore object using the combine
object function. Use the combined datastore to train object detectors using the training
functions such as trainYOLOv4ObjectDetector and trainSSDObjectDetector. To modify the ReadSize
property, you can use dot notation.
Creation
Description
blds = boxLabelDatastore(tbl1,...,tbln)boxLabelDatastore object from one or more tables
containing labeled bounding box data.
Input Arguments
Labeled bounding box data, specified as a table with one or more columns. Each table corresponds to a set of labels. The bounding boxes can be axis-aligned rectangles, rotated rectangles, or cuboids. The table below describes the format of the bounding boxes.
| Bounding Box | Description |
|---|---|
| Axis-aligned rectangle |
Defined in spatial coordinates as an M-by-4 numeric matrix with rows of the form [x y w h], where:
|
| Rotated rectangle |
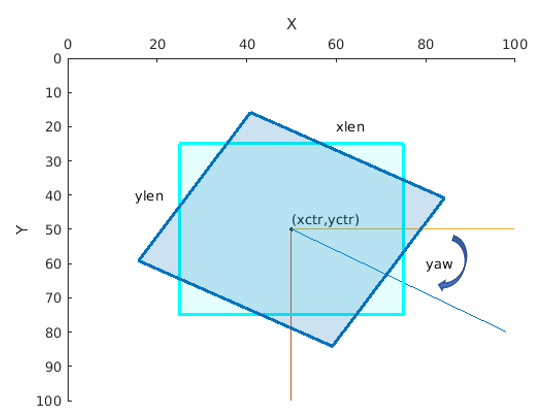
Defined in spatial coordinates as an M-by-5 numeric matrix with rows of the form [xctr yctr xlen ylen yaw], where:
|
| Cuboid |
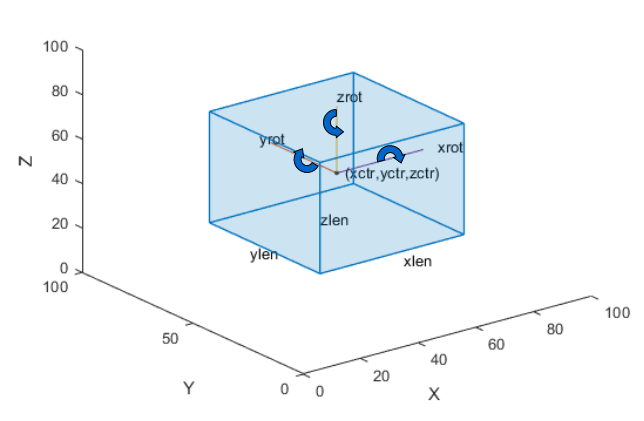
Defined in spatial coordinates as an M-by-9 numeric matrix with rows of the form [xctr yctr zctr xlen ylen zlen xrot yrot zrot], where:
The figure shows how these values determine the position of a cuboid.
|
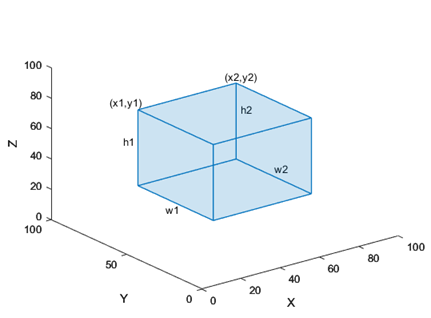
| Projected Cuboid |
The figure shows how these values determine the position of a cuboid.
|
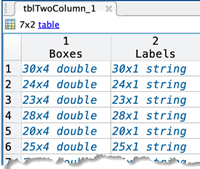
A table with one or more columns:
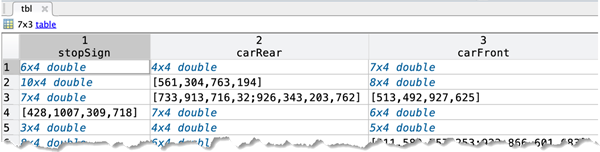
All columns contain bounding boxes. Each column must be a cell vector containing M-by-N matrices. M is the number of images and N represents a single object class, such as stopSign, carRear, or carFront.
A table with two columns.
The first column contains bounding boxes. The second column must be a cell vector that contains the label names corresponding to each bounding box. Each element in the cell vector must be an M-by-1 categorical or string vector, where M represents the number of labels.
To create a ground truth table, use the Image Labeler or Video Labeler app. To create a table of training data from
the generated ground truth, use the objectDetectorTrainingData function.
Data Types: table
Block locations, specified as a blockLocationSet object. You can create this object by
using the balanceBoxLabels function or the blockLocationsWithROI function.
Properties
Object Functions
combine | Combine data from multiple datastores |
countEachLabel | Count occurrence of pixel or box labels |
hasdata | Determine if data is available to read from label datastore |
numpartitions | Number of partitions for label datastore |
partition | Partition label datastore |
preview | Read first row of data in datastore |
progress | Percentage of data read from a datastore |
read | Read data from label datastore |
readall | Read all data in label datastore |
reset | Reset label datastore to initial state |
shuffle | Return shuffled version of label datastore |
subset | Create subset of datastore or FileSet |
transform | Transform datastore |
isPartitionable | Determine whether datastore is partitionable |
isShuffleable | Determine whether datastore is shuffleable |
Examples
This example shows how to estimate anchor boxes using a table containing the training data. The first column contains the training images and the remaining columns contain the labeled bounding boxes.
data = load("vehicleTrainingData.mat");
trainingData = data.vehicleTrainingData;
Create a boxLabelDatastore object using the labeled bounding boxes from the training data.
blds = boxLabelDatastore(trainingData(:,2:end));
Specify the class names using the labels from the training data.
classes = trainingData.Properties.VariableNames(2:end);
Estimate the anchor boxes using the boxLabelDatastore object.
numAnchors = 5;
anchorBoxes = estimateAnchorBoxes(blds,numAnchors);
Specify the image size.
inputImageSize = [128 228 3];
Use a pretrained ResNet-50 network as a base network for the YOLO v2 network.
baseNet = imagePretrainedNetwork("resnet50");Specify the network layer to use for feature extraction. You can use the analyzeNetwork function to see all the layer names in a network.
featureLayer = "activation_49_relu";Create the YOLO v2 object detection network.
detector = yolov2ObjectDetector(baseNet,classes,anchorBoxes, ...
    DetectionNetworkSource=featureLayer)
detector =
yolov2ObjectDetector with properties:
Network: [1×1 dlnetwork]
InputSize: [224 224 3]
TrainingImageSize: [224 224]
AnchorBoxes: [5×2 double]
ClassNames: vehicle
ReorganizeLayerSource: ''
LossFactors: [5 1 1 1]
ModelName: ''
Visualize the network using the network analyzer.
analyzeNetwork(detector.Network)
Load a table of vehicle class training data that contains bounding boxes with labels.
data = load('vehicleTrainingData.mat');
trainingData = data.vehicleTrainingData;
Add the fullpath to the local vehicle data folder.
dataDir = fullfile(toolboxdir('vision'),'visiondata');
trainingData.imageFilename = fullfile(dataDir,trainingData.imageFilename);
Create an imageDatastore object using the file names in the table.
imds = imageDatastore(trainingData.imageFilename);
Create a boxLabelDatastore object using the table with label data.
blds = boxLabelDatastore(trainingData(:,2:end));
Combine the imageDatastore and boxLabelDatastore objects.
cds = combine(imds,blds);
Read the data for training. Use the read object function to return images, bounding boxes, and labels.
read(cds)
ans=1×3 cell array
    {128×228×3 uint8}    {[126 78 20 16]}    {[vehicle]}
Load a table of vehicle class training data that contains bounding boxes with labels.
load('vehicleTrainingData.mat');Load a table of stop signs and cars class training data that contains bounding boxes with labels.
load('stopSignsAndCars.mat');Create ground truth tables from the training data.
vehiclesTbl  = vehicleTrainingData(:,2:end);
stopSignsTbl = stopSignsAndCars(:,2:end);
Create a boxLabelDatastore object using two tables: one with vehicle label data and the other with the stop signs and cars label data.
blds = boxLabelDatastore(vehiclesTbl,stopSignsTbl);
Create an imageDatastore object using the file names in the training data tables.
dataDir = fullfile(toolboxdir('vision'),'visiondata');
vehicleFiles = fullfile(dataDir,vehicleTrainingData.imageFilename);
stopSignFiles = fullfile(dataDir,stopSignsAndCars.imageFilename);
imds = imageDatastore([vehicleFiles;stopSignFiles]);
Combine the imageDatastore and boxLabelDatastore objects.
cds = combine(imds,blds);
Read the data for training. Use the read object function to return images, bounding boxes, and labels.
read(cds)
ans=1×3 cell array
    {128×228×3 uint8}    {[126 78 20 16]}    {[vehicle]}
Load box labels data that contains boxes and labels for one image. The height and width of each box is 20-by-20 pixels.
d = load("balanceBoxLabelsData.mat");
boxLabels = d.BoxLabels;
Create a blocked image of size 500-by-500 pixels.
blockedImages = blockedImage(zeros([500 500]));
Choose the images size of each observation.
blockSize = [50 50];
Visualize using a histogram to identify any class imbalance in the box labels.
blds = boxLabelDatastore(boxLabels);
datasetCount = countEachLabel(blds);
figure
unbalancedLabels = datasetCount.Label;
unbalancedCount  = datasetCount.Count;
h1 = histogram(Categories=unbalancedLabels,BinCounts=unbalancedCount);
title("Unbalanced Class Labels")
Measure the distribution of box labels. If the coefficient of variation is more than 1, then there is class imbalance.
cvBefore = std(datasetCount.Count)/mean(datasetCount.Count)
cvBefore =
1.5746
Choose a heuristic value for number of observations by finding the mean of the counts of each class, multiplied by the number of classes.
numClasses = height(datasetCount);
numObservations = mean(datasetCount.Count) * numClasses;
Control the amount a box can be cut using OverlapThreshold. Using a lower threshold value will cut objects more at the border of a block. Increase this value to reduce the amount an object can be clipped at the border, at the expense of a less balanced box labels.
ThresholdValue = 0.5;
Balance boxLabels using the balanceBoxLabels function.
locationSet = balanceBoxLabels(boxLabels,blockedImages,blockSize, ...
        numObservations,OverlapThreshold=ThresholdValue);
[==================================================] 100% Elaps[==================================================] 100% Elapsed time: 00:00:00 Estimated time remaining: 00:00:00 Balancing box labels complete.
Count the labels that are contained within the image blocks.
bldsBalanced = boxLabelDatastore(boxLabels,locationSet);
balancedDatasetCount = countEachLabel(bldsBalanced);
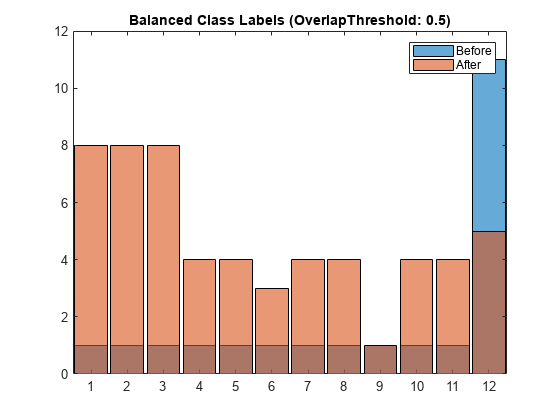
Overlay another histogram against the original label count to see if the box labels are balanced. If the labels appear to be not balanced by looking at the histograms, increase the value for numObservations.
hold on
balancedLabels = balancedDatasetCount.Label;
balancedCount  = balancedDatasetCount.Count;
h2 = histogram(Categories=balancedLabels,BinCounts=balancedCount);
title(h2.Parent,"Balanced Class Labels (OverlapThreshold: " + ThresholdValue + ")" )
legend(h2.Parent,["Before" "After"])
Measure the distribution of the new balanced box labels.
cvAfter = std(balancedCount)/mean(balancedCount)
cvAfter =
0.4588
Version History
Introduced in R2019bSee Also
Apps
Functions
balanceBoxLabels|blockLocationsWithROI|analyzeNetwork(Deep Learning Toolbox) |estimateAnchorBoxes
Objects
Topics
- Datastores for Deep Learning (Deep Learning Toolbox)
- Deep Learning in MATLAB (Deep Learning Toolbox)
- Training Data for Object Detection and Semantic Segmentation