时域和频域分析
系统响应,如波特图和阶跃响应;系统特性,如响应时间和超调;仿真
函数
App
| 线性系统分析器 | 分析线性时不变 (LTI) 系统的时域响应和频域响应 |
工具
| 线性仿真工具 | Specify input signals and initial conditions for simulating linear models with arbitrary input signals and initial conditions |
实时编辑器任务
| 创建绘图 | Interactively create linear analysis response plots in the Live Editor (自 R2022b 起) |
模块
| LTI System | 在 Simulink 中使用线性时不变系统模型对象 |
主题
分析图基础知识
- 绘制系统响应
此示例概述了如何生成时域和频域响应图。
时域分析
- Time-Domain Responses
Generate and visualize time-response data such as step response and impulse response.
- 响应图上的时域特征
在响应图上可视化时域系统特征(如稳定时间、超调量)。 - Numeric Values of Time-Domain System Characteristics
Use thestepinfofunction to obtain numeric values of step response characteristics such as rise time, settling time, and overshoot.
频域分析
- 频域响应
生成并可视化频率响应数据,例如使用波特图和尼柯尔斯图。
- 响应图上的频域特征
在图上可视化频域系统特征(如峰值响应)。 - Numeric Values of Frequency-Domain Characteristics of SISO Model
Obtain numeric values of frequency-domain characteristics such as peak gain, dc gain, and system bandwidth.
线性系统分析器
- Joint Time-Domain and Frequency-Domain Analysis
Compare multiple types of responses side by side, including both time-domain and frequency-domain responses, using the Linear System Analyzer app. - Analyzing MIMO Models
In analysis plots of multiple-input, multiple output LTI models, there are plot tools for selecting subsystems and grouping I/O pairs.
具有时滞的系统
- Analyze Dynamic Systems with Time Delays
The time and frequency responses of delay systems can have features that can look odd to those only familiar with delay-free LTI analysis. - Analyze Control Systems with Delays
Many processes involve dead times, also referred to as transport delays or time lags. Controlling such processes is challenging because delays cause phase shifts that limit the control bandwidth and affect closed-loop stability. - Validate Simulation Results for Models with Internal Delays
Validate the accuracy of simulations with internal delays by varying sample time. (自 R2026a 起)
相关信息
精选示例
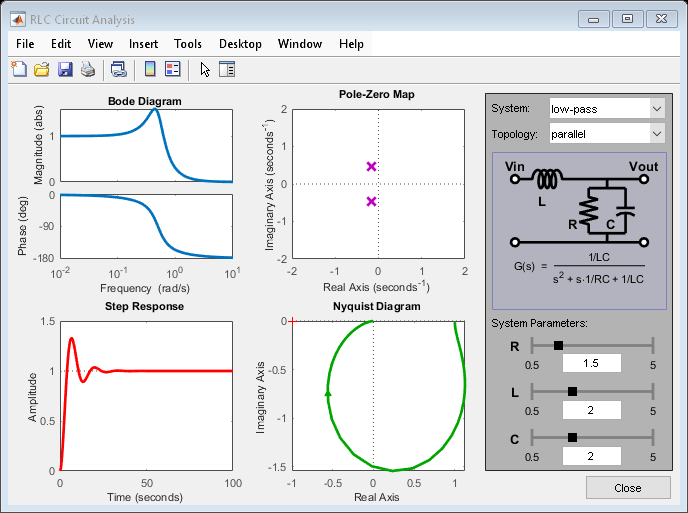
分析 RLC 电路的响应
分析二阶系统的时间和频率响应。

Use Linearization Offsets to Help Compare Nonlinear and Linearized Responses
Use offsets from linearization to facilitate the comparison of the nonlinear and linearized responses of a Simulink model.
教学资源

动态系统的传递函数分析
了解如何计算传递函数,并利用极点、零点和波特图对传递函数进行分析。