Get Started with Image Segmentation
Image segmentation is a process in image processing and computer vision that involves dividing an image into multiple segments or regions. The primary goal of image segmentation is to identify objects and boundaries in images. Image segmentation plays a key role in various applications, including scientific imaging, traffic control systems, machine vision, face and text recognition, and image editing and computer graphics. You can use image segmentation for various tasks, including:
Basic image processing, such as differentiating objects from the background or from each other.
First step in tasks that requires precise delineation and pixel-level localization of objects in an image, such as object analysis and quantification.
Subsequent processing step that creates boundaries or masks at the pixel level after objects have been identified, such as in instance segmentation tasks.
Which image segmentation technique you choose often depends on your specific application and the characteristics of the images to be segmented.
This table lists the techniques for image segmentation available in Image Processing Toolbox™, Computer Vision Toolbox™, and Medical Imaging Toolbox™. Each entry provides basic background information, tips for getting started, and a representative visualization.
| Technique | Get Started | Visualization of Sample Output |
|---|---|---|
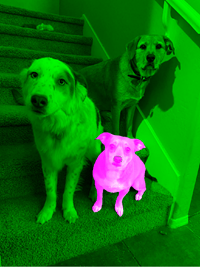
Segment Anything Model (SAM) – Segment images automatically and interactively. |
To learn more, see Get Started with Segment Anything Model for Image Segmentation. |
|
Classical image segmentation techniques – Apply semi-automated and automated image segmentation algorithms, as well as processing methods such as thresholding. | Use one of the Segmentation Techniques functions or interactive apps, such as the Image Segmenter app and Color Thresholder app, to:
To learn more, see the Classical Image Segmentation Techniques section. |
|
Semantic segmentation techniques (Computer Vision Toolbox) – Train a deep learning neural network on a custom data set to segment images with complex scenes or domain-specific objects. |
To learn more, see Get Started with Semantic Segmentation Using Deep Learning (Computer Vision Toolbox). |
|
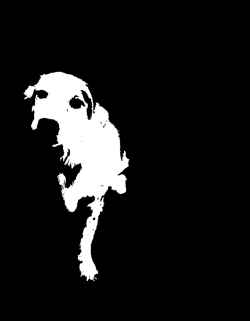
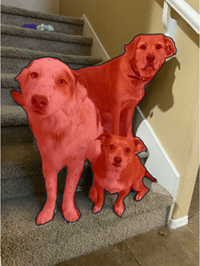
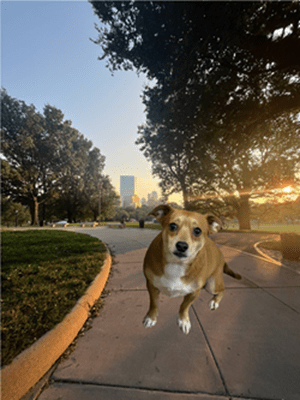
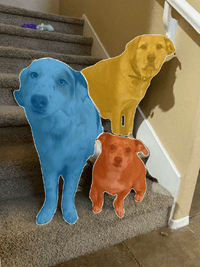
Instance segmentation techniques (Computer Vision Toolbox) – Train a deep learning instance segmentation model, or use a pretrained model to segment instances of objects in images. |
To learn more, see Get Started with Instance Segmentation Using Deep Learning (Computer Vision Toolbox). |
|
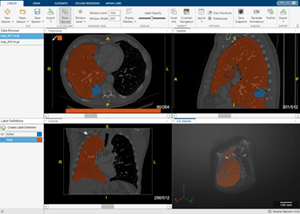
Medical image segmentation (Medical Imaging Toolbox) – Perform medical image segmentation using deep learning, a labeling app, or image processing algorithms. |
For more information, see Analysis and Applications (Medical Imaging Toolbox). |
|
Classical Image Segmentation Techniques
Use the classical segmentation techniques available in Image Processing Toolbox when GPU hardware resources are limited and computing speed is critical. To get started with classical techniques using the Image Segmenter app for increased interactivity, see Getting Started with Image Segmenter. Use this table to select a technique based on the characteristics of your image and application.
| Image Characteristics | Recommended Classical Techniques | Example |
|---|---|---|
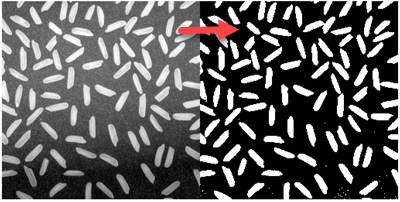
| Clear and well-defined boundaries | Threshold methods such as multithresh, otsuthresh, adaptthresh, and
graythresh can easily
separate objects from the background based on intensity levels. |
For an example that uses this image, see Find Threshold and Segment Bright Rice Grains from Dark Background. |
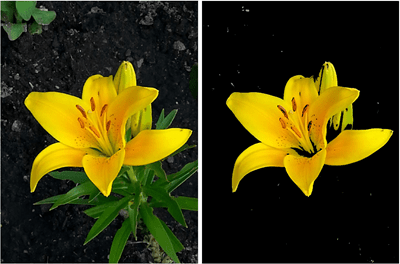
| Images with distinct color regions | To create a binary mask for objects that have distinct colors that contrast significantly with the background or other objects, or objects of uniform color, use the Color Thresholder app. |
For an example that uses the Color Thresholder app, see Segment Image and Create Mask Using Color Thresholder. |
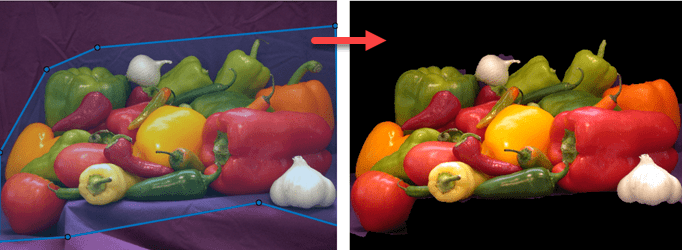
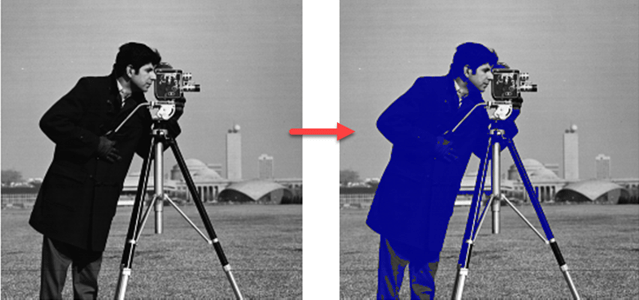
| Blurry or low-contrast boundaries | Use graph-based methods, such as the Use the Use the |
For an example that uses this image, see Segment Foreground from Background in Image Using Grabcut. |
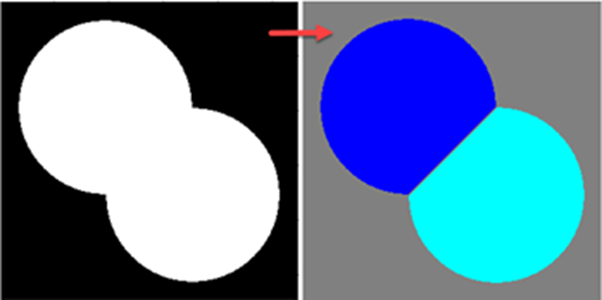
| Overlapping or touching objects | The watershed transform watershed can help
separate objects that are touching by identifying the
watershed lines between different objects based
on the gradient. |
For an example that uses this image, see Compute Watershed Transform and Display Resulting Label Matrix. |
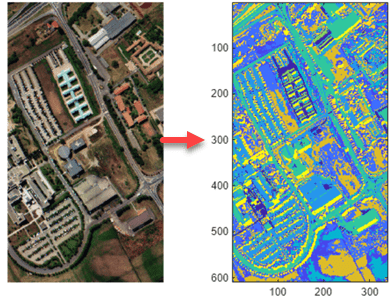
| Objects with similar intensity to the background | You can perform clustering using the imsegkmeans, imsegkmeans3, and imsegisodata functions to segment an image into clusters
based on color or intensity and spatial proximity. These methods can
separate objects from the background even when their intensities are
similar, but subtly distinct. Use k-means and ISODATA clustering
functions to effectively partition an image or volume where distinct
colors or intensities represent different segments. |
For an example that uses this image, see Segment 2-D Hyperspectral Image Using ISODATA Clustering. |
| Objects with texture or internal variation | Region-based methods, using the watershed or grayconnected functions,
can help segment objects with internal variation, as they group pixels
or subregions into larger regions based on predefined criteria, such as
texture or color. |
For an example that uses this image, see Segment Image Using Flood-Fill Technique. |
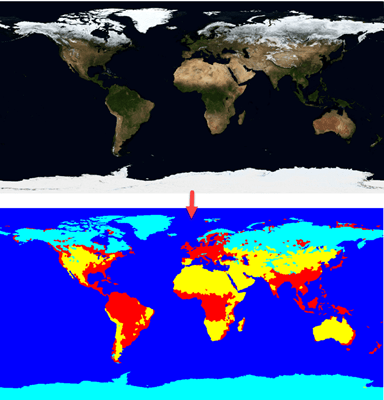
| Large-scale images | For large images containing a lot of detail, you can significantly
reduce computational load by using the superpixels region-based method
of the superpixels or
superpixels3
function. |
For an example that uses this image, see Plot Land Classification with Color Features and Superpixels. |
Visualize Segmentation Results
Visualize segmentation results to verify the accuracy of the segmentation (how well the segmented regions match the objects of interest), interpret your segmentation results, and identify potential postprocessing steps such as mask refinement. This table describes the options for visualizing segmentation results in Image Processing Toolbox and Computer Vision Toolbox, and the corresponding functions and representative visualization.
| Visualization Task | Function | Visualization Example |
|---|---|---|
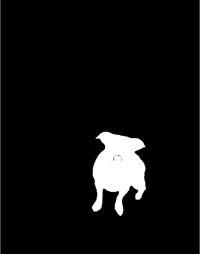
| Display a binary mask or image. | imshow |
|
| Overlay a binary mask on an image. | imoverlay |
|
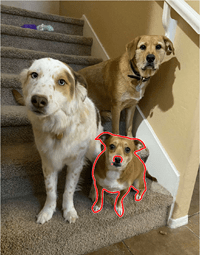
| Display boundaries of segmented regions over an image. | visboundaries |
|
| Overlay a label matrix on an image, coloring each segmented region differently based on its label. | labeloverlay |
|
| Combine two images, or an image and a mask, into a single visual output. | imfuse |
|
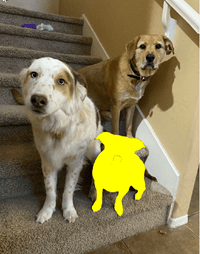
| Combine two images into a single, cohesive, composite image. You can specify to blend only the region of the foreground image specified by the mask. | imblend |
|
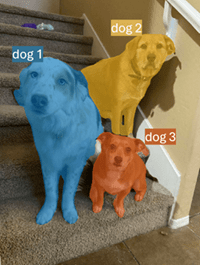
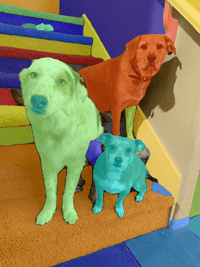
| Display a mask or a stack of masks overlaid on an image, and optionally specify a unique color for each mask. | insertObjectMask (Computer Vision Toolbox) |
|
MATLAB® supports a wide range of colormaps and enables you to create custom visualization functions. You can tailor a visualization to the specific requirements of your application, such as highlighting particular features or ensuring that visualizations are accessible to viewers with color vision deficiencies.
Evaluate Segmentation Results
Evaluate segmentation results by using quantitative metrics to measure how well a segmentation technique performs, and ensure that it meets the specific requirements of your application. This table describes the options for evaluating segmentation results using the functions in Image Processing Toolbox and Computer Vision Toolbox.
| Goal | Function | Evaluation Approach |
|---|---|---|
Evaluate the overlap between the segmentation and a ground truth mask. | jaccard | Compute the Jaccard similarity coefficient, a measure of the intersection over union for the segmented result and the ground truth. |
Evaluate the overlap between the segmentation and a ground truth mask, assessing the accuracy of the model in capturing the shape and size of segmented objects. | dice | Compute the Dice similarity coefficient, which is twice the area of overlap divided by the total number of pixels in both the ground truth and the segmented image. |
Evaluate how accurately the boundaries of the segmented regions match the actual boundaries. | bfscore | Compute the Boundary F1 Score (BF score) between the segmented boundary and the ground truth boundary. |
Evaluate the overlap between predicted and ground truth segmentations in semantic segmentation tasks that have imbalanced data sets with varying class frequencies. | generalizedDice (Computer Vision Toolbox) | Compute the weighted average of the Dice similarity coefficient across different classes, accounting for class imbalance. |
Evaluate semantic segmentation results against the ground truth, classifying each pixel into one of several categories. | evaluateSemanticSegmentation (Computer Vision Toolbox) | Compare semantic segmentation results against the ground truth data by computing standard metrics, including pixel accuracy, mean IoU, and weighted IoU. |
Evaluate instance segmentation results against the ground truth. | evaluateInstanceSegmentation (Computer Vision Toolbox) | Compare instance segmentation results against the ground truth data by computing standard metrics, including the confusion matrix, average precision, and precision recall. |
See Also
Apps
- Image Segmenter | Color Thresholder | Image Labeler (Computer Vision Toolbox)
Functions
imsegsam|semanticseg(Computer Vision Toolbox)
Topics
- Getting Started with Image Segmenter
- Get Started with Segment Anything Model for Image Segmentation
- Segment Objects Using Segment Anything Model (SAM) in Image Segmenter
- Automatically Label Ground Truth Using Segment Anything Model (Computer Vision Toolbox)
- Specify ROI as Binary Mask
- Get Started with Image Preprocessing and Augmentation for Deep Learning (Computer Vision Toolbox)
- Get Started with Medical Segment Anything Model for Medical Image Segmentation (Medical Imaging Toolbox)